
Distillate U.S. Fundamental
Stability & Value ETF | Ticker DSTL

Distillate U.S. Fundamental Stability & Value ETF | DSTL Process
DSTL adheres to a systematic process, including only those stocks that meet the firm’s proprietary cash-flow-based valuation and quality criteria.
- DSTL begins with a starting universe of around 500 profitable large-cap U.S. stocks.
- Our security selection focuses on U.S. stocks with low debt levels and stable cash flows.
- We then invest in the most attractively valued remaining 100 companies based on Distillate Capital’s normalized free cash flow methodology.
- The portfolio is weighted by free cash flow generation and is rebalanced quarterly.
As of 01/30/2026
| Ticker | DSTL |
| NAV | 59.94 |
| Market Price | 59.93 |
| Net Assets | $1,877,694,521 |
| Shares Outstanding | 31,325,000 |
| 30-day SEC Yield as of 12/31/2025 | 1.34% |
| Inception | 10/23/2018 |
| Primary Exchange | NYSE |
| CUSIP | 26922A321 |
| Expense Ratio | 0.39% |
| Premium/Discount % | -0.02 |
| Median 30-day Bid/Ask Spread | 0.05% |
The 30-day SEC yield represents the dividends and interest earned over the preceding 30-day period, annualized, and divided by the net asset value (NAV) per share at the end of the period.
Median 30-Day Spread is a calculation of Fund’s median bid-ask spread, expressed as a percentage rounded to the nearest hundredth, computed by: identifying the Fund’s national best bid and national best offer as of the end of each 10 second interval during each trading day of the last 30 calendar days; dividing the difference between each such bid and offer by the midpoint of the national best bid and national best offer; and identifying the median of those values.
GROWTH OF $10,000
SINCE INCEPTION
10/23/2018-12/31/2025
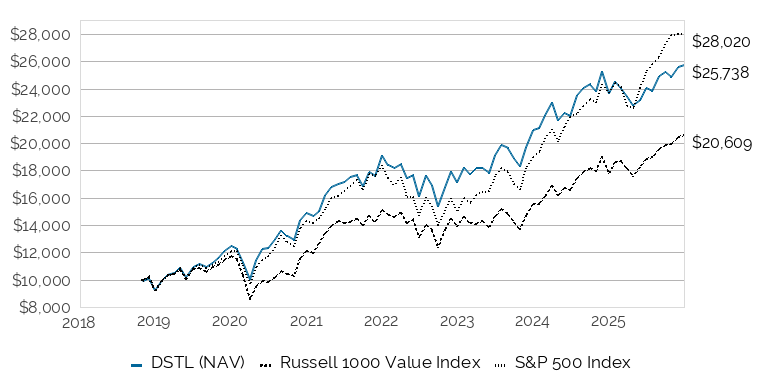
This chart illustrates the performance of a hypothetical $10,000 investment made on 12/14/2020, and is not intended to imply any future performance. The returns shown do not reflect the deduction of taxes that a shareholder would pay on fund distributions or the redemption of fund shares. The chart assumes reinvestment of capital gains and dividends.
PERFORMANCE
As of 12/31/2025
| YTD | 1 YR1 | 3 YR | 5 YR | SINCE INCEPTION2 | |
|---|---|---|---|---|---|
| 1DSTL NAV | 8.62% | 8.62% | 14.56% | 11.63% | 14.05% |
| 2DSTL MKT | 8.71% | 8.71% | 14.59% | 11.61% | 14.05% |
| 4Russell 1000 Value Index | 15.91% | 15.91% | 13.90% | 11.33% | 10.61% |
| 3S&P 500 TR | 17.88% | 17.88% | 23.01% | 14.42% | 15.43% |
Fund expense ratio: 0.39%
1Performance greater than 1 year is annualized.
2Inception 10/23/18.
Performance data quoted represents past performance and does not guarantee future results. Investment returns and principal value will fluctuate, and when sold, may be worth more or less than their original cost. Performance current to the most recent month-end may be lower or higher than the performance quoted and can be obtained by calling 800.617.0004. Market price returns are based on price of the last reported trade on the fund’s primary exchange where the shares are listed. NAV return is the percentage change between the fund’s net asset value (the value of each share’s portion of the fund’s underlying assets and cash at the end of the trading day) at the beginning and end of a particular period.
As of 01/30/2026
| 2023 | 2024 | 2025 | Q1 2026 | Q2 2026 | Q3 2026 | Q4 2026 | |
|---|---|---|---|---|---|---|---|
| Days at premium | 153 | 136 | 107 | 7 | - | - | - |
| Days at zero premium/discount | 28 | 22 | 14 | 1 | - | - | - |
| Days at discount | 66 | 94 | 130 | 12 | - | - | - |
DISTRIBUTIONS
| Ex-Date | Record Date | Payable Date | Amount | Type |
|---|---|---|---|---|
| 12/29/2025 | 12/29/2025 | 12/30/2025 | $0.19306 | Div Income |
| 09/24/2025 | 09/24/2025 | 09/25/2025 | $0.18300 | Div Income |
| 06/25/2025 | 06/25/2025 | 06/26/2025 | $0.18607 | Div Income |
| 03/26/2025 | 03/26/2025 | 03/27/2025 | $0.20954 | Div Income |
| 12/27/2024 | 12/27/2024 | 12/30/2024 | $0.23271 | Div Income |
| 09/25/2024 | 09/25/2024 | 09/26/2024 | $0.14932 | Div Income |
| 06/26/2024 | 06/26/2024 | 06/27/2024 | $0.20262 | Div Income |
| 03/20/2024 | 03/21/2024 | 03/22/2024 | $0.15402 | Div Income |
TOP 10 HOLDINGS
As of 02/02/2026
| Percent Net Assets | Name | Identifier | Shares Held | Market Value |
|---|---|---|---|---|
| 2.48% | AbbVie Inc | 00287Y109 | 209,185.00 | $46,650,346.85 |
| 2.48% | Merck & Co Inc | 58933Y105 | 423,145.00 | $46,660,199.15 |
| 2.27% | T-Mobile US Inc | 872590104 | 215,680.00 | $42,534,252.80 |
| 2.14% | Johnson & Johnson | 478160104 | 176,510.00 | $40,111,897.50 |
| 2.06% | Procter & Gamble Co/The | 742718109 | 254,282.00 | $38,592,379.14 |
| 1.88% | Cisco Systems Inc | 17275R102 | 450,810.00 | $35,307,439.20 |
| 1.84% | Bristol-Myers Squibb Co | 110122108 | 626,160.00 | $34,470,108.00 |
| 1.79% | Comcast Corp | 20030N101 | 1,131,293.00 | $33,655,966.75 |
| 1.59% | Lockheed Martin Corp | 539830109 | 47,018.00 | $29,819,755.96 |
| 1.52% | Amgen Inc | 031162100 | 83,496.00 | $28,545,612.48 |
| 1.51% | Accenture PLC | G1151C101 | 107,407.00 | $28,316,781.48 |
| 1.48% | Cigna Group/The | 125523100 | 101,589.00 | $27,846,560.79 |
| 1.46% | Salesforce Inc | 79466L302 | 129,336.00 | $27,456,739.44 |
| 1.46% | Uber Technologies Inc | 90353T100 | 343,543.00 | $27,500,617.15 |
| 1.40% | QUALCOMM Inc | 747525103 | 173,602.00 | $26,316,327.18 |
| 1.36% | Altria Group Inc | 02209S103 | 411,344.00 | $25,499,214.56 |
| 1.30% | FedEx Corp | 31428X106 | 75,950.00 | $24,474,887.50 |
| 1.29% | McKesson Corp | 58155Q103 | 29,066.00 | $24,159,949.86 |
| 1.29% | Marathon Petroleum Corp | 56585A102 | 137,006.00 | $24,139,087.14 |
| 1.26% | Booking Holdings Inc | 09857L108 | 4,733.00 | $23,673,708.72 |
| 1.21% | Union Pacific Corp | 907818108 | 96,880.00 | $22,776,488.00 |
| 1.11% | Adobe Inc | 00724F101 | 70,970.00 | $20,811,952.50 |
| 1.10% | PACCAR Inc | 693718108 | 167,354.00 | $20,569,480.14 |
| 1.07% | Regeneron Pharmaceuticals Inc | 75886F107 | 27,020.00 | $20,033,979.00 |
| 1.05% | Diamondback Energy Inc | 25278X109 | 120,020.00 | $19,677,279.00 |
| 1.04% | General Dynamics Corp | 369550108 | 55,417.00 | $19,456,354.53 |
| 1.04% | PayPal Holdings Inc | 70450Y103 | 369,616.00 | $19,475,067.04 |
| 1.03% | Vistra Corp | 92840M102 | 121,944.00 | $19,309,832.40 |
| 1.01% | Cardinal Health Inc | 14149Y108 | 88,553.00 | $19,028,268.64 |
| 0.99% | Colgate-Palmolive Co | 194162103 | 205,083.00 | $18,516,944.07 |
| 0.99% | DR Horton Inc | 23331A109 | 124,462.00 | $18,524,924.08 |
| 0.98% | TopBuild Corp | 89055F103 | 39,220.00 | $18,356,921.00 |
| 0.98% | TechnipFMC PLC | G87110105 | 330,499.00 | $18,415,404.28 |
| 0.96% | Becton Dickinson & Co | 075887109 | 88,187.00 | $17,944,290.76 |
| 0.96% | Cboe Global Markets Inc | 12503M108 | 68,159.00 | $18,066,224.54 |
| 0.96% | Marsh & McLennan Cos Inc | 571748102 | 95,908.00 | $18,048,926.52 |
| 0.96% | Constellation Brands Inc | 21036P108 | 115,542.00 | $18,105,431.40 |
| 0.95% | Arthur J Gallagher & Co | 363576109 | 71,444.00 | $17,815,990.28 |
| 0.94% | TE Connectivity PLC | G87052109 | 79,422.00 | $17,693,633.16 |
| 0.93% | Cencora Inc | 03073E105 | 48,801.00 | $17,530,295.22 |
| 0.93% | EMCOR Group Inc | 29084Q100 | 24,185.00 | $17,430,855.05 |
| 0.92% | Jazz Pharmaceuticals PLC | G50871105 | 104,608.00 | $17,206,969.92 |
| 0.90% | Automatic Data Processing Inc | 053015103 | 68,547.00 | $16,918,770.54 |
| 0.90% | Align Technology Inc | 016255101 | 103,896.00 | $16,938,164.88 |
| 0.90% | PulteGroup Inc | 745867101 | 134,621.00 | $16,839,740.89 |
| 0.89% | US Foods Holding Corp | 912008109 | 200,046.00 | $16,727,846.52 |
| 0.88% | CACI International Inc | 127190304 | 26,552.00 | $16,477,640.16 |
| 0.87% | Airbnb Inc | 009066101 | 125,935.00 | $16,292,210.95 |
| 0.87% | Kroger Co/The | 501044101 | 259,120.00 | $16,285,692.00 |
| 0.87% | ResMed Inc | 761152107 | 63,550.00 | $16,415,600.50 |
| 0.87% | Sysco Corp | 871829107 | 195,439.00 | $16,387,560.15 |
| 0.85% | Permian Resources Corp | 71424F105 | 986,323.00 | $15,909,389.99 |
| 0.85% | Tenet Healthcare Corp | 88033G407 | 84,640.00 | $16,020,659.20 |
| 0.84% | Quest Diagnostics Inc | 74834L100 | 84,531.00 | $15,809,832.93 |
| 0.84% | LKQ Corp | 501889208 | 478,085.00 | $15,705,092.25 |
| 0.84% | Textron Inc | 883203101 | 180,094.00 | $15,859,077.64 |
| 0.83% | Coterra Energy Inc | 127097103 | 540,413.00 | $15,590,915.05 |
| 0.83% | Global Payments Inc | 37940X102 | 217,766.00 | $15,622,532.84 |
| 0.81% | Carlisle Cos Inc | 142339100 | 44,730.00 | $15,248,009.70 |
| 0.81% | Cognizant Technology Solutions Corp | 192446102 | 185,721.00 | $15,240,265.26 |
| 0.80% | Owens Corning | 690742101 | 125,814.00 | $15,077,549.76 |
| 0.79% | EPAM Systems Inc | 29414B104 | 70,674.00 | $14,742,596.40 |
| 0.79% | Paychex Inc | 704326107 | 143,980.00 | $14,848,657.40 |
| 0.79% | SS&C Technologies Holdings Inc | 78467J100 | 180,499.00 | $14,781,063.11 |
| 0.78% | Church & Dwight Co Inc | 171340102 | 151,851.00 | $14,615,658.75 |
| 0.78% | ON Semiconductor Corp | 682189105 | 246,080.00 | $14,737,731.20 |
| 0.78% | Snap-on Inc | 833034101 | 40,255.00 | $14,737,758.05 |
| 0.78% | Toll Brothers Inc | 889478103 | 101,606.00 | $14,681,050.94 |
| 0.77% | Crocs Inc | 227046109 | 171,684.00 | $14,407,721.28 |
| 0.77% | Jabil Inc | 466313103 | 60,719.00 | $14,401,939.61 |
| 0.76% | Universal Health Services Inc | 913903100 | 71,241.00 | $14,337,963.66 |
| 0.76% | Williams-Sonoma Inc | 969904101 | 69,415.00 | $14,205,779.75 |
| 0.75% | Zoom Communications Inc | 98980L101 | 152,024.00 | $14,001,410.40 |
| 0.74% | Fortive Corp | 34959J108 | 262,752.00 | $13,875,933.12 |
| 0.73% | First American Government Obligations Fund 12/01/2031 | 31846V336 | 13,788,432.03 | $13,788,432.03 |
| 0.72% | Applied Industrial Technologies Inc | 03820C105 | 51,741.00 | $13,473,873.81 |
| 0.72% | CDW Corp/DE | 12514G108 | 107,280.00 | $13,559,119.20 |
| 0.71% | F5 Inc | 315616102 | 48,663.00 | $13,412,009.43 |
| 0.71% | NVR Inc | 62944T105 | 1,751.00 | $13,370,163.23 |
| 0.71% | Smurfit WestRock PLC | G8267P108 | 321,717.00 | $13,393,078.71 |
| 0.70% | A O Smith Corp | 831865209 | 178,149.00 | $13,092,170.01 |
| 0.69% | Deckers Outdoor Corp | 243537107 | 108,164.00 | $12,908,291.76 |
| 0.69% | Omnicom Group Inc | 681919106 | 167,653.00 | $12,915,987.12 |
| 0.67% | Avery Dennison Corp | 053611109 | 68,031.00 | $12,620,430.81 |
| 0.67% | IDEX Corp | 45167R104 | 63,564.00 | $12,620,632.20 |
| 0.66% | Corpay Inc | 219948106 | 39,363.00 | $12,384,780.69 |
| 0.66% | Lennox International Inc | 526107107 | 25,125.00 | $12,438,885.00 |
| 0.65% | Acuity Inc | 00508Y102 | 39,411.00 | $12,179,575.44 |
| 0.64% | FactSet Research Systems Inc | 303075105 | 47,123.00 | $11,986,206.28 |
| 0.64% | Neurocrine Biosciences Inc | 64125C109 | 88,143.00 | $11,992,736.58 |
| 0.64% | Pinterest Inc | 72352L106 | 544,579.00 | $12,051,533.27 |
| 0.63% | Amdocs Ltd | G02602103 | 143,872.00 | $11,788,871.68 |
| 0.62% | Crown Holdings Inc | 228368106 | 110,560.00 | $11,573,420.80 |
| 0.62% | Roper Technologies Inc | 776696106 | 31,309.00 | $11,622,840.07 |
| 0.61% | Gartner Inc | 366651107 | 54,233.00 | $11,367,779.13 |
| 0.61% | Masco Corp | 574599106 | 171,976.00 | $11,365,893.84 |
| 0.60% | Brown & Brown Inc | 115236101 | 157,496.00 | $11,355,461.60 |
| 0.60% | ICON PLC | G4705A100 | 62,954.00 | $11,347,458.50 |
| 0.58% | NetApp Inc | 64110D104 | 112,300.00 | $10,820,105.00 |
| 0.55% | Dropbox Inc | 26210C104 | 407,777.00 | $10,390,157.96 |
| 0.55% | GoDaddy Inc | 380237107 | 103,302.00 | $10,383,917.04 |
| 0.09% | Cash & Other | Cash&Other | 1,705,135.69 | $1,705,135.69 |
| 0.08% | Versant Media Group Inc | 925283103 | 45,432.00 | $1,480,174.56 |
Holdings are subject to change at any time and should not be considered a recommendation to buy or sell any security.
LITERATURE
IMPORTANT INFORMATION
The Funds’ investment objectives, risks, charges, and expenses must be considered carefully before investing. The prospectus contains this and other important information about the investment company. Please read it carefully before investing. A hard copy of the prospectus can be requested by calling 1-800-617-0004.
Investing involves risk, including the possible loss of principal.
Shares of any ETF are bought and sold at market price (not NAV) and may trade at a discount or premium to NAV. Shares are not individually redeemed from the Fund. Brokerage commissions will reduce returns. The NAV of the Fund’s shares is calculated each day the national securities exchanges are open for trading as of the close of regular trading on the New York Stock Exchange (“NYSE”), normally 4:00 p.m. Eastern time (the “NAV Calculation Time”). Market price returns are based on either or both of the last trade of the day before the close of regular trading or the midpoint of the bid/ask spread at 4:00 pm Eastern Time (when NAV is normally determined).
Equity Market Risk: The equity securities held in the Fund’s portfolio may experience sudden, unpredictable drops in value or long periods of decline in value. This may occur because of factors that affect securities markets generally or factors affecting specific issuers, industries, or sectors in which the Fund invests. Management Risk: The Fund is actively managed and may not meet its investment objective based on the Adviser’s success or failure to implement investment strategies for the Fund.
Free Cash Flow (or Cash Flow): Refers to the cash generated by a business after accounting for capital investments required to maintain or grow the business.
S&P 500 Index: Tracks the performance of roughly 500 of the largest U.S. stocks. Russell 1000 Value Index: Tracks the performance large-cap U.S. stocks exhibiting value characteristics as defined by FTSE Russell. It is not possible to invest directly in an index.
The Distillate Capital ETFs are distributed by Quasar Distributors, LLC.