

U.S. Small/Mid Cap Quality & Value (SMID QV) Process
Goal: Preserving capital in down markets and keeping pace in rising ones
- SMID QV begins with a starting universe of around 1,000 profitable small- and mid-cap U.S. stocks.
- Our security selection process eliminates those stocks with high debt levels,
- We then invest in the most attractively valued remaining 150 companies based on Distillate Capital’s normalized free cash flow methodology.
- The portfolio is weighted by free cash flow generation and is rebalanced quarterly.
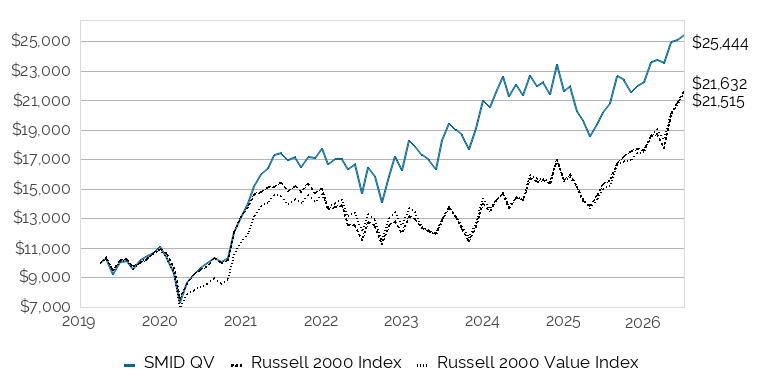
GROWTH OF $10,000
SINCE INCEPTION
3/31/2019-6/30/2026
PERFORMANCE1
As of 6/30/2026
| 1 YR | 3 YR | 5 YR | SINCE INCEPTION2 | |
|---|---|---|---|---|
| 1Distillate U.S. Small/Mid QV (net) | 25.74% | 11.59% | 7.82% | 13.75% |
| 1Russell 2000 Index | 40.91% | 18.62% | 6.98% | 11.23% |
| 1Russell 2000 Value Index | 43.18% | 18.76% | 8.23% | 11.15% |
1Performance greater than 1 year is annualized.
2Inception 3/31/19.
CALENDAR YEAR PERFORMANCE
As of 6/30/2026
1 Inception 3/31/19 through 12/31/2019.
| 20191 | 2020 | 2021 | 2022 | 2023 | 2024 | 2025 | 2026 YTD | |
|---|---|---|---|---|---|---|---|---|
| 1Distillate U.S. Small/Mid QV (net) | 11.65% | 17.15% | 36.03% | -8.64% | 29.46% | 2.92% | 2.63% | 14.47% |
| 1Russell 2000 Index | 9.49% | 19.91% | 14.64% | -20.49% | 16.81% | 11.53% | 12.79% | 22.69% |
| 1Russell 2000 Value Index | 9.18% | 4.50% | 27.96% | -14.67% | 14.43% | 8.04% | 12.58% | 23.15% |
VALUATION &
RISK METRICS
As of 7/10/2026
| Free Cash Flow to Market Cap (NTM) | Free Cash Flow to Enterprise Value (NTM) | P/E (NTM) | Leverage | |
|---|---|---|---|---|
| DISTILLATE U.S. SMALL/MID QV (net) | 9.8% | 8.0% | 10.6 | 0.8 |
| Russell 2000 Index | 2.4% | 1.4% | 16.5 | 1.6 |
| Russell 2000 Value Index | 4.1% | 2.2% | 12.6 | 2.3 |
Strategy Performance
Investing involves risks and you may incur a profit or a loss. Past performance is no guarantee of future results.
One cannot invest directly in an index. All performance data above source: U.S. Bank, Morningstar Data.
Portfolio Characteristics
Free Cash Flow to Market Cap reflects next-twelve-month consensus (FactSet) free cash flow estimates divided by market capitalization, excluding those stocks >50% and <-20%. Free Cash Flow to Enterprise Value reflects next-twelve-month consensus (FactSet) free cash flow divided by enterprise value (market capitalization plus adjusted net debt), excluding those stocks >100% and <-100%. P/E is a measure of per share market value compared to next-twelve-month consensus (FactSet) EPS estimates. It excludes PE ratios less than 0 or greater than 250. Leverage is a measure of a company’s Adjusted Net Debt divided by the average of its estimated FY1 and FY2 Earnings Before Interest Taxes Depreciation & Amortization (FactSet).
Data for SMID QV reflects the constituents of a representative composite account.
Disclosures
Distillate Capital Partners, LLC (“Distillate”), is an investment adviser registered with the United States Securities and Exchange Commission in accordance with the Investment Advisers Act of 1940. Registration as an investment advisor does not imply a certain level of skill or training. Distillate claims compliance with the Global Investment Performance Standards (GIPS®). GIPS® is a registered trademark of CFA Institute. CFA Institute does not endorse or promote this organization, nor does it warrant the accuracy or quality of the content contained herein. To receive a GIPS Report and/or our firm’s list of composite descriptions please email your request to info@distillatecapital.com. A copy of our strategies’ GIPS Reports can be downloaded here.
Returns are presented net of management fees and include the reinvestment of all income. Net of fee performance was calculated using an annual management fee rate of 0.55% applied 1/12th monthly, which is the highest investment management fee that may be charged for this composite. Policies for valuing portfolios, calculating performance, and preparing GIPS Reports are available upon request.