
Distillate International Fundamental
Stability & Value ETF | Ticker DSTX

Distillate International Fundamental Stability & Value ETF | DSTX Process
DSTX adheres to a systematic process, including only those stocks that meet the firm’s proprietary cash-flow-based valuation and quality criteria.
- DSTX begins with a starting universe of more than 1,200 large, profitable non-U.S. stocks.
- Our security selection focuses on stocks with low debt levels and stable cash flows.
- We then invest in the most attractively valued remaining 100 companies based on Distillate Capital’s normalized free cash flow methodology.
- The portfolio is weighted by free cash flow generation and is rebalanced quarterly.
As of 07/24/2026
| Ticker | DSTX |
| NAV | 33.82 |
| Market Price | 33.76 |
| Net Assets | $57,492,082 |
| Shares Outstanding | 1,700,000 |
| 30-day SEC Yield as of 6/30/2026 | 2.10% |
| Inception | 12/14/2020 |
| Primary Exchange | NYSE |
| CUSIP | 26922B501 |
| Expense Ratio | 0.55% |
| Premium/Discount % | -0.17 |
| Median 30-day Bid/Ask Spread | 0.15% |
The 30-day SEC yield represents the dividends and interest earned over the preceding 30-day period, annualized, and divided by the net asset value (NAV) per share at the end of the period.
Median 30-Day Spread is a calculation of Fund’s median bid-ask spread, expressed as a percentage rounded to the nearest hundredth, computed by: identifying the Fund’s national best bid and national best offer as of the end of each 10 second interval during each trading day of the last 30 calendar days; dividing the difference between each such bid and offer by the midpoint of the national best bid and national best offer; and identifying the median of those values.
GROWTH OF $10,000
SINCE INCEPTION
12/14/2020-6/30/2026
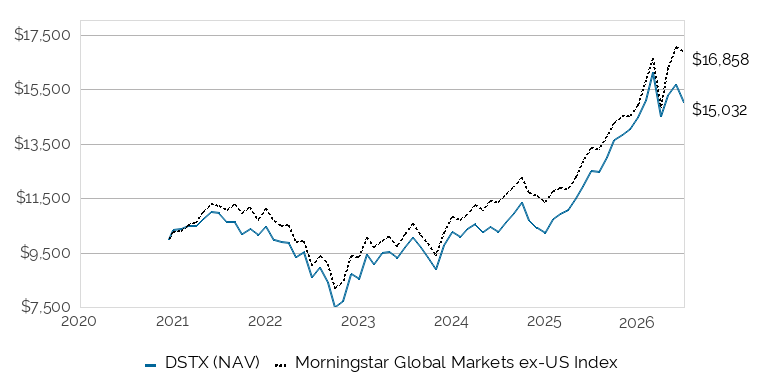
This chart illustrates the performance of a hypothetical $10,000 investment made on 12/14/2020, and is not intended to imply any future performance. The returns shown do not reflect the deduction of taxes that a shareholder would pay on fund distributions or the redemption of fund shares. The chart assumes reinvestment of capital gains and dividends.
PERFORMANCE
As of 06/30/2026
| YTD | 1 YR1 | 3 YR | SINCE INCEPTION2 | |
|---|---|---|---|---|
| 1DSTX NAV | 3.89% | 20.23% | 15.76% | 7.63% |
| 2DSTX MKT | 4.47% | 20.34% | 15.70% | 7.70% |
| 3Morningstar Global Markets ex-US NR USD | 12.86% | 26.48% | 18.34% | 9.88% |
Fund expense ratio: 0.55%
1Performance greater than 1 year is annualized.
2Inception 12/14/20.
Performance data quoted represents past performance and does not guarantee future results. Investment returns and principal value will fluctuate, and when sold, may be worth more or less than their original cost. Performance current to the most recent month-end may be lower or higher than the performance quoted and can be obtained by calling 800.617.0004. Market price returns are based on price of the last reported trade on the fund’s primary exchange where the shares are listed. NAV return is the percentage change between the fund’s net asset value (the value of each share’s portion of the fund’s underlying assets and cash at the end of the trading day) at the beginning and end of a particular period.
As of 07/24/2026
| 2023 | 2024 | 2025 | Q1 2026 | Q2 2026 | Q3 2026 | Q4 2026 | |
|---|---|---|---|---|---|---|---|
| Days at premium | 167 | 133 | 130 | 38 | 38 | 12 | - |
| Days at zero premium/discount | 4 | 3 | 3 | 0 | 1 | 0 | - |
| Days at discount | 76 | 116 | 118 | 23 | 23 | 5 | - |
DISTRIBUTIONS
| Ex-Date | Record Date | Payable Date | Amount | Type |
|---|---|---|---|---|
| 06/25/2026 | 06/25/2026 | 06/26/2026 | $0.38600 | Div Income |
| 03/26/2026 | 03/26/2026 | 03/27/2026 | $0.07107 | Div Income |
| 12/29/2025 | 12/29/2025 | 12/30/2025 | $0.47145 | Div Income |
| 09/24/2025 | 09/24/2025 | 09/25/2025 | $0.08061 | Div Income |
| 06/25/2025 | 06/25/2025 | 06/26/2025 | $0.29875 | Div Income |
| 03/26/2025 | 03/26/2025 | 03/27/2025 | $0.07757 | Div Income |
| 12/27/2024 | 12/27/2024 | 12/30/2024 | $0.16308 | Div Income |
| 09/25/2024 | 09/25/2024 | 09/26/2024 | $0.05917 | Div Income |
TOP 10 HOLDINGS
As of 07/27/2026
| Percent Net Assets | Name | Identifier | Shares Held | Market Value |
|---|---|---|---|---|
| 2.21% | CANADIAN NAT RES LTD | 2171573 | 27,321.00 | $1,270,446.39 |
| 2.11% | Suncor Energy Inc | B3NB1P2 | 18,403.00 | $1,213,449.24 |
| 1.97% | Sanofi SA | 5671735 | 13,096.00 | $1,132,996.76 |
| 1.73% | Aluminum Corp of China Ltd | 6425395 | 940,000.00 | $994,899.26 |
| 1.72% | British American Tobacco PLC | 110448107 | 16,187.00 | $986,759.52 |
| 1.68% | NetEase Inc | BM93SF4 | 40,400.00 | $966,982.91 |
| 1.66% | Tokio Marine Holdings Inc | 6513126 | 19,300.00 | $956,602.03 |
| 1.56% | HD Hyundai Co Ltd | BD4HFT1 | 5,913.00 | $897,283.89 |
| 1.48% | JD.com Inc | BKPQZT6 | 56,600.00 | $852,392.25 |
| 1.36% | Vinci SA | B1XH026 | 5,823.00 | $784,187.77 |
| 1.33% | Constellation Software Inc/Canada | B15C4L6 | 404.00 | $765,234.50 |
| 1.33% | Roche Holding AG | 771195104 | 14,008.00 | $766,237.60 |
| 1.30% | Gold Fields Ltd | 6280215 | 22,840.00 | $745,673.11 |
| 1.30% | Sea Ltd | 81141R100 | 7,481.00 | $748,100.00 |
| 1.26% | Geely Automobile Holdings Ltd | 6531827 | 299,000.00 | $726,720.22 |
| 1.25% | Kia Corp | 6490928 | 8,059.00 | $717,271.61 |
| 1.23% | MTN Group Ltd | 6563206 | 52,323.00 | $706,996.50 |
| 1.20% | JD Logistics Inc | BNMBPD9 | 387,800.00 | $691,828.87 |
| 1.17% | London Stock Exchange Group PLC | B0SWJX3 | 5,770.00 | $674,743.17 |
| 1.15% | Rio Tinto Ltd | 6220103 | 5,919.00 | $661,798.57 |
| 1.14% | EQT AB | BJ7W9K4 | 20,139.00 | $653,472.98 |
| 1.14% | NESTE OYJ | B06YV46 | 18,256.00 | $652,912.55 |
| 1.09% | Bridgestone Corp | 6132101 | 27,600.00 | $626,349.51 |
| 1.09% | Telkom Indonesia Persero Tbk PT | BD4T6W7 | 4,266,700.00 | $625,497.27 |
| 1.08% | Publicis Groupe SA | 4380429 | 6,153.00 | $619,073.82 |
| 1.07% | AKER BP ASA | B1L95G3 | 17,270.00 | $614,109.37 |
| 1.07% | Cie de Saint-Gobain SA | 7380482 | 7,289.00 | $615,095.69 |
| 1.07% | Telefonica Brasil SA | B6XFBX3 | 87,597.00 | $615,070.93 |
| 1.05% | Whitecap Resources Inc | B418WK4 | 51,517.00 | $602,187.14 |
| 1.03% | Dassault Systemes SE | BM8H5Y5 | 26,140.00 | $591,326.00 |
| 1.03% | Bouygues SA | 4002121 | 10,990.00 | $594,513.72 |
| 1.03% | Heidelberg Materials AG | 5120679 | 3,094.00 | $592,528.76 |
| 1.03% | PRIO SA/Brazil | BYY0144 | 50,905.00 | $590,998.51 |
| 1.03% | Wolters Kluwer NV | 5671519 | 8,364.00 | $594,457.78 |
| 1.02% | Denso Corp | 6640381 | 48,800.00 | $589,194.17 |
| 1.01% | JD Health International Inc | BMW8R04 | 122,550.00 | $578,213.47 |
| 1.01% | NEC Corp | 6640400 | 22,300.00 | $578,660.11 |
| 0.99% | Fujitsu Ltd | 6356945 | 28,400.00 | $568,711.11 |
| 0.99% | Kinross Gold Corp | B03Z841 | 23,751.00 | $567,736.86 |
| 0.99% | Yara International ASA | 7751259 | 11,960.00 | $569,675.48 |
| 0.98% | Partners Group Holding AG | B119QG0 | 677.00 | $560,647.09 |
| 0.97% | IMPERIAL BRANDS PLC | 0454492 | 14,854.00 | $558,881.01 |
| 0.96% | Yangzijiang Shipbuilding Holdings Ltd | B1VT035 | 177,300.00 | $549,554.44 |
| 0.94% | CGI Inc | BJ2L575 | 8,152.00 | $541,807.11 |
| 0.94% | Norsk Hydro ASA | B11HK39 | 59,980.00 | $539,569.76 |
| 0.93% | Shionogi & Co Ltd | 6804682 | 30,600.00 | $533,624.23 |
| 0.92% | Eiffage SA | B13X013 | 3,797.00 | $527,115.08 |
| 0.92% | INFOSYS LTD | 456788108 | 47,851.00 | $531,624.61 |
| 0.91% | Astellas Pharma Inc | 6985383 | 39,500.00 | $522,622.06 |
| 0.91% | Aisin Corp | 6010702 | 37,300.00 | $525,177.26 |
| 0.91% | Capgemini SE | 4163437 | 5,119.00 | $523,544.02 |
| 0.90% | Tongcheng Travel Holdings Ltd | BGM5R25 | 308,800.00 | $518,604.44 |
| 0.90% | Magna International Inc | 559222401 | 7,859.00 | $516,021.94 |
| 0.89% | LPP SA | 7127979 | 96.00 | $509,981.01 |
| 0.88% | Shenzhou International Group Holdings Ltd | B0MP1B0 | 93,700.00 | $508,766.39 |
| 0.88% | Adyen NV | BZ1HM42 | 553.00 | $504,037.28 |
| 0.88% | Lundin Gold Inc | BTKSSY6 | 8,998.00 | $507,233.77 |
| 0.88% | Sonova Holding AG | 7156036 | 1,948.00 | $503,739.69 |
| 0.87% | Krafton Inc | BMBP900 | 3,021.00 | $499,636.83 |
| 0.87% | Essity AB | BF1K7P7 | 17,654.00 | $502,461.96 |
| 0.85% | Bureau Veritas SA | B28DTJ6 | 15,898.00 | $488,078.24 |
| 0.84% | Bunzl PLC | B0744B3 | 13,134.00 | $482,787.84 |
| 0.84% | Ipsen SA | B0R7JF1 | 2,675.00 | $482,152.00 |
| 0.83% | Nitto Denko Corp | 6641801 | 23,500.00 | $476,759.60 |
| 0.83% | Secom Co Ltd | 6791591 | 11,500.00 | $477,712.30 |
| 0.83% | Harmony Gold Mining Co Ltd | 6410562 | 29,910.00 | $477,136.88 |
| 0.83% | Nexi SpA | BJ1F880 | 105,431.00 | $474,842.00 |
| 0.81% | Eva Airways Corp | 6186023 | 369,000.00 | $462,827.82 |
| 0.81% | Euronext NV | BNBNSG0 | 2,734.00 | $463,542.75 |
| 0.81% | GEA Group AG | 4557104 | 6,459.00 | $467,074.17 |
| 0.81% | Mowi ASA | B02L486 | 22,541.00 | $465,624.41 |
| 0.80% | Equinox Gold Corp | BKLNP13 | 49,812.00 | $462,692.87 |
| 0.80% | Evolution Mining Ltd | B3X0F91 | 57,936.00 | $457,116.71 |
| 0.80% | Sage Group PLC/The | B8C3BL0 | 40,332.00 | $461,321.10 |
| 0.79% | TIM SA/Brazil | BN71RB6 | 106,038.00 | $452,598.03 |
| 0.78% | MatsukiyoCocokara & Co | B249GC0 | 29,800.00 | $447,423.13 |
| 0.78% | Genmab A/S | 4595739 | 1,563.00 | $446,904.50 |
| 0.78% | Open Text Corp | 2260824 | 20,094.00 | $450,354.47 |
| 0.76% | IMCD NV | BNCBD46 | 4,325.00 | $434,168.36 |
| 0.76% | Securitas AB | 5554041 | 28,227.00 | $439,056.94 |
| 0.74% | Suzuki Motor Corp | 6865504 | 35,300.00 | $424,367.46 |
| 0.74% | Bandai Namco Holdings Inc | B0JDQD4 | 16,900.00 | $424,293.26 |
| 0.74% | DCC Energy plc | 0242493 | 5,076.00 | $425,198.72 |
| 0.73% | Hyundai Glovis Co Ltd | B0V3XR5 | 2,968.00 | $419,011.76 |
| 0.73% | TISI Inc | B2Q4CR0 | 19,700.00 | $419,878.47 |
| 0.73% | Ono Pharmaceutical Co Ltd | 6660107 | 28,200.00 | $419,353.26 |
| 0.73% | Beiersdorf AG | 5107401 | 4,782.00 | $421,929.97 |
| 0.72% | Suntory Beverage & Food Ltd | BBD7Q84 | 14,600.00 | $412,824.82 |
| 0.72% | Pandora A/S | B44XTX8 | 3,602.00 | $415,363.39 |
| 0.69% | Unicharm Corp | 6911485 | 67,700.00 | $395,752.18 |
| 0.69% | Boliden AB | BPYTZ57 | 7,999.00 | $396,662.33 |
| 0.68% | Realtek Semiconductor Corp | 6051422 | 17,000.00 | $389,780.89 |
| 0.68% | Otsuka Corp | 6267058 | 21,100.00 | $389,927.02 |
| 0.68% | Nice Ltd | 653656108 | 4,343.00 | $391,999.18 |
| 0.66% | Oracle Corp Japan | 6141680 | 7,500.00 | $380,439.10 |
| 0.64% | Trend Micro Inc/Japan | 6125286 | 9,600.00 | $367,537.33 |
| 0.63% | Wipro Ltd | 97651M109 | 195,118.00 | $361,627.80 |
| 0.62% | Zalando SE | BQV0SV7 | 11,370.00 | $355,017.35 |
| 0.61% | Autotrader Group PLC | BVYVFW2 | 53,943.00 | $351,639.63 |
| 0.60% | Buzzi SpA | 5782206 | 7,400.00 | $342,713.44 |
| 0.55% | First American Government Obligations Fund 12/01/2031 | 31846V336 | 316,006.96 | $316,006.96 |
| 0.36% | Cash & Other | Cash&Other | 206,407.34 | $206,407.34 |
| 0.02% | BRITISH POUNDS | CASHGBP | 6,592.23 | $8,786.13 |
| 0.00% | Constellation Software Inc/Canada | BR52TP7 | 138.00 | $0.00 |
| 0.00% | BRAZILIAN REAL | CASHBRL | 652.62 | $128.90 |
| 0.00% | CANADIAN DOLLAR | CASHCAD | -1,003.70 | $-712.78 |
| 0.00% | JAPANESE YEN | CASHJPY | 24,113.00 | $147.26 |
Holdings are subject to change at any time and should not be considered a recommendation to buy or sell any security.
LITERATURE
IMPORTANT INFORMATION
The Funds’ investment objectives, risks, charges, and expenses must be considered carefully before investing. The prospectus contains this and other important information about the investment company. Please read it carefully before investing. A hard copy of the prospectus can be requested by calling 1-800-617-0004.
Investing involves risk, including the possible loss of principal.
Shares of any ETF are bought and sold at market price (not NAV) and may trade at a discount or premium to NAV. Shares are not individually redeemed from the Fund. Brokerage commissions will reduce returns.The NAV of the Fund’s shares is calculated each day the national securities exchanges are open for trading as of the close of regular trading on the New York Stock Exchange (“NYSE”), normally 4:00 p.m. Eastern time (the “NAV Calculation Time”). Market price returns are based on either or both of the last trade of the day before the close of regular trading or the midpoint of the bid/ask spread at 4:00 pm Eastern Time (when NAV is normally determined).
To the extent the Fund invests more heavily in particular sectors of the economy, its performance will be especially sensitive to developments that significantly affect those sectors. Market Capitalization Risk. The securities of small- and mid-capitalization companies may be more vulnerable to adverse issuer, market, political, or economic developments than securities of large-capitalization companies. Foreign Securities Risk: The Fund invests in foreign securities which involve political, economic and currency risks, greater volatility and differences in accounting methods. These risks are greater in emerging markets.
Free Cash Flow (or Cash Flow): Refers to the cash generated by a business after accounting for capital investments required to maintain or grow the business.
Morningstar Global Markets Ex-U.S. Index: An unmanaged index of common stock prices, weighted by market value. Its performance is thought to be representative of the non-U.S. stock market as a whole. It is not possible to invest directly in an index.
The Distillate Capital ETFs are distributed by PINE Distributors LLC.