
Distillate Small/Mid
Cash Flow ETF | Ticker DSMC

Distillate Small/Mid Cash Flow ETF | DSMC Process
DSMC adheres to a systematic process, including only those stocks that meet the firm’s proprietary cash-flow-based valuation and quality criteria.
- DSMC begins with a starting universe of around 1,000 profitable small-and mid-cap U.S stock.
- Our security selection process eliminates those stocks with high debt levels.
- We then invest in the most attractively valued remaining 150 companies based on Distillate Capital’s normalized free cash flow methodology.
- The portfolio is weighted by free cash flow generation and is rebalanced quarterly.
As of 07/31/2026
| Ticker | DSMC |
| NAV | 42.61 |
| Market Price | 42.60 |
| Net Assets | $137,402,427 |
| Shares Outstanding | 3,225,000 |
| 30-day SEC Yield as of 6/30/2026 | 1.08% |
| Inception | 10/5/2022 |
| Primary Exchange | NYSE |
| CUSIP | 26922B667 |
| Expense Ratio | 0.55% |
| Premium/Discount % | 0.00 |
| Median 30-day Bid/Ask Spread | 0.12% |
The 30-day SEC yield represents the dividends and interest earned over the preceding 30-day period, annualized, and divided by the net asset value (NAV) per share at the end of the period.
Median 30-Day Spread is a calculation of Fund’s median bid-ask spread, expressed as a percentage rounded to the nearest hundredth, computed by: identifying the Fund’s national best bid and national best offer as of the end of each 10 second interval during each trading day of the last 30 calendar days; dividing the difference between each such bid and offer by the midpoint of the national best bid and national best offer; and identifying the median of those values.
GROWTH OF $10,000
SINCE INCEPTION
10/5/2022-6/30/2026
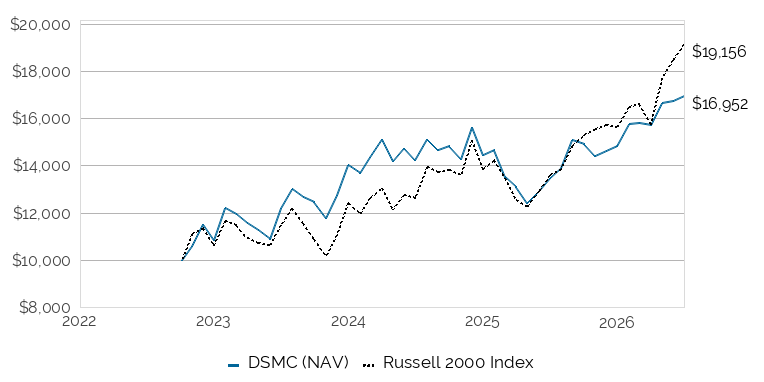
This chart illustrates the performance of a hypothetical $10,000 investment made on 10/5/2022, and is not intended to imply any future performance. The returns shown do not reflect the deduction of taxes that a shareholder would pay on fund distributions or the redemption of fund shares. The chart assumes reinvestment of capital gains and dividends.
PERFORMANCE
As of 06/30/2026
| YTD | 1 YR1 | 3 YR | SINCE INCEPTION2 | |
|---|---|---|---|---|
| 1DSMC NAV | 14.47% | 25.74% | 11.59% | 15.18% |
| 2DSMC MKT | 14.45% | 25.67% | 11.59% | 15.20% |
| 3Russell 2000 Index | 22.57% | 40.78% | 18.60% | 17.20% |
Fund expense ratio: 0.55%
1Performance greater than 1 year is annualized.
2Inception 10/5/22.
Performance data quoted represents past performance and does not guarantee future results. Investment returns and principal value will fluctuate, and when sold, may be worth more or less than their original cost. Performance current to the most recent month-end may be lower or higher than the performance quoted and can be obtained by calling 800.617.0004. Market price returns are based on price of the last reported trade on the fund’s primary exchange where the shares are listed. NAV return is the percentage change between the fund’s net asset value (the value of each share’s portion of the fund’s underlying assets and cash at the end of the trading day) at the beginning and end of a particular period.
As of 07/31/2026
| 2023 | 2024 | 2025 | Q1 2026 | Q2 2026 | Q3 2026 | Q4 2026 | |
|---|---|---|---|---|---|---|---|
| Days at premium | 141 | 212 | 177 | 41 | 35 | 13 | - |
| Days at zero premium/discount | 20 | 8 | 11 | 2 | 5 | 1 | - |
| Days at discount | 86 | 32 | 63 | 18 | 22 | 8 | - |
DISTRIBUTIONS
| Ex-Date | Record Date | Payable Date | Amount | Type |
|---|---|---|---|---|
| 06/25/2026 | 06/25/2026 | 06/26/2026 | $0.12303 | Div Income |
| 03/26/2026 | 03/26/2026 | 03/27/2026 | $0.10517 | Div Income |
| 12/29/2025 | 12/29/2025 | 12/30/2025 | $0.15086 | Div Income |
| 09/24/2025 | 09/24/2025 | 09/25/2025 | $0.08623 | Div Income |
| 06/25/2025 | 06/25/2025 | 06/26/2025 | $0.10760 | Div Income |
| 03/26/2025 | 03/26/2025 | 03/27/2025 | $0.07560 | Div Income |
| 12/27/2024 | 12/27/2024 | 12/30/2024 | $0.16000 | Div Income |
| 09/25/2024 | 09/25/2024 | 09/26/2024 | $0.09517 | Div Income |
TOP 10 HOLDINGS
As of 08/03/2026
| Percent Net Assets | Name | Identifier | Shares Held | Market Value |
|---|---|---|---|---|
| 1.36% | HF Sinclair Corp | 403949100 | 20,504.00 | $1,875,500.88 |
| 1.23% | CDW Corp/DE | 12514G108 | 11,462.00 | $1,694,198.22 |
| 1.17% | Versant Media Group Inc | 925283103 | 44,662.00 | $1,607,385.38 |
| 1.16% | DXC Technology Co | 23355L106 | 141,408.00 | $1,589,425.92 |
| 1.15% | Invesco Ltd | G491BT108 | 53,457.00 | $1,582,327.20 |
| 1.03% | APA Corp | 03743Q108 | 37,761.00 | $1,409,240.52 |
| 1.03% | Toll Brothers Inc | 889478103 | 9,667.00 | $1,410,318.63 |
| 1.02% | First American Government Obligations Fund 12/01/2031 | 31846V336 | 1,400,220.04 | $1,400,220.04 |
| 1.01% | Carlisle Cos Inc | 142339100 | 3,860.00 | $1,389,291.20 |
| 1.00% | Jazz Pharmaceuticals PLC | G50871105 | 5,441.00 | $1,375,811.26 |
| 0.95% | Masco Corp | 574599106 | 18,179.00 | $1,299,434.92 |
| 0.95% | Oscar Health Inc | 687793109 | 41,765.00 | $1,303,903.30 |
| 0.93% | Cal-Maine Foods Inc | 128030202 | 14,510.00 | $1,273,687.80 |
| 0.93% | Gartner Inc | 366651107 | 8,450.00 | $1,276,119.00 |
| 0.91% | GoDaddy Inc | 380237107 | 15,091.00 | $1,248,629.34 |
| 0.91% | Universal Health Services Inc | 913903100 | 7,408.00 | $1,247,803.52 |
| 0.90% | Antero Resources Corp | 03674X106 | 34,110.00 | $1,232,735.40 |
| 0.90% | Chord Energy Corp | 674215207 | 8,807.00 | $1,236,326.66 |
| 0.90% | Crocs Inc | 227046109 | 9,652.00 | $1,235,552.52 |
| 0.89% | Dropbox Inc | 26210C104 | 37,700.00 | $1,227,512.00 |
| 0.88% | Hormel Foods Corp | 440452100 | 48,339.00 | $1,208,958.39 |
| 0.88% | Mohawk Industries Inc | 608190104 | 9,862.00 | $1,214,012.20 |
| 0.88% | Par Pacific Holdings Inc | 69888T207 | 14,083.00 | $1,211,560.49 |
| 0.86% | H&R Block Inc | 093671105 | 26,866.00 | $1,182,909.98 |
| 0.84% | Match Group Inc | 57667L107 | 29,366.00 | $1,157,314.06 |
| 0.83% | Insight Enterprises Inc | 45765U103 | 8,808.00 | $1,135,615.44 |
| 0.83% | Skyworks Solutions Inc | 83088M102 | 18,317.00 | $1,140,782.76 |
| 0.82% | Ingredion Inc | 457187102 | 11,290.00 | $1,122,903.40 |
| 0.81% | Robert Half Inc | 770323103 | 29,288.00 | $1,107,086.40 |
| 0.80% | Abercrombie & Fitch Co | 002896207 | 11,020.00 | $1,096,930.80 |
| 0.80% | TriNet Group Inc | 896288107 | 16,775.00 | $1,104,298.25 |
| 0.80% | WEX Inc | 96208T104 | 5,890.00 | $1,101,194.40 |
| 0.79% | Bath & Body Works Inc | 070830104 | 54,028.00 | $1,087,043.36 |
| 0.79% | Pilgrim's Pride Corp | 72147K108 | 39,486.00 | $1,080,336.96 |
| 0.78% | FactSet Research Systems Inc | 303075105 | 4,062.00 | $1,069,118.40 |
| 0.77% | Smithfield Foods Inc | 832248207 | 40,859.00 | $1,063,968.36 |
| 0.76% | Dillard's Inc | 254067101 | 1,766.00 | $1,039,008.44 |
| 0.76% | Murphy Oil Corp | 626717102 | 26,366.00 | $1,047,784.84 |
| 0.75% | AECOM | 00766T100 | 14,324.00 | $1,036,914.36 |
| 0.75% | Acuity Inc | 00508Y102 | 3,118.00 | $1,023,920.02 |
| 0.74% | Genpact Ltd | G3922B107 | 28,901.00 | $1,016,448.17 |
| 0.73% | A O Smith Corp | 831865209 | 16,784.00 | $1,009,221.92 |
| 0.73% | Core & Main Inc | 21874C102 | 22,720.00 | $998,998.40 |
| 0.73% | Pool Corp | 73278L105 | 5,411.00 | $1,004,876.81 |
| 0.72% | Blackbaud Inc | 09227Q100 | 23,053.00 | $986,668.40 |
| 0.72% | LKQ Corp | 501889208 | 44,168.00 | $991,571.60 |
| 0.71% | Reynolds Consumer Products Inc | 76171L106 | 39,002.00 | $972,709.88 |
| 0.70% | Gap Inc/The | 364760108 | 48,189.00 | $968,117.01 |
| 0.70% | Mattel Inc | 577081102 | 63,634.00 | $960,237.06 |
| 0.70% | Signet Jewelers Ltd | G81276100 | 10,379.00 | $964,209.10 |
| 0.69% | Euronet Worldwide Inc | 298736109 | 13,251.00 | $945,193.83 |
| 0.69% | International Seaways Inc | Y41053102 | 9,794.00 | $941,986.92 |
| 0.69% | Teekay Tankers Ltd | G8726X106 | 11,933.00 | $947,122.21 |
| 0.68% | Brink's Co/The | 109696104 | 7,871.00 | $932,319.95 |
| 0.68% | Payoneer Global Inc | 70451X104 | 130,319.00 | $934,387.23 |
| 0.68% | Qualys Inc | 74758T303 | 6,474.00 | $937,111.50 |
| 0.68% | Vontier Corp | 928881101 | 29,245.00 | $939,641.85 |
| 0.67% | G-III Apparel Group Ltd | 36237H101 | 25,398.00 | $924,741.18 |
| 0.67% | Magnite Inc | 55955D100 | 47,518.00 | $917,097.40 |
| 0.67% | Myers Industries Inc | 628464109 | 27,042.00 | $923,754.72 |
| 0.67% | Insperity Inc | 45778Q107 | 18,163.00 | $919,229.43 |
| 0.66% | AMN Healthcare Services Inc | 001744101 | 27,095.00 | $911,204.85 |
| 0.66% | EVERTEC Inc | 30040P103 | 29,625.00 | $900,303.75 |
| 0.66% | Interparfums Inc | 458334109 | 7,233.00 | $900,870.15 |
| 0.66% | KBR Inc | 48242W106 | 24,942.00 | $913,126.62 |
| 0.66% | NOV Inc | 62955J103 | 46,368.00 | $900,930.24 |
| 0.66% | Thor Industries Inc | 885160101 | 12,049.00 | $903,313.53 |
| 0.65% | Amdocs Ltd | G02602103 | 15,931.00 | $887,675.32 |
| 0.65% | EPAM Systems Inc | 29414B104 | 8,477.00 | $894,832.12 |
| 0.65% | PVH Corp | 693656100 | 10,291.00 | $891,818.06 |
| 0.64% | Certara Inc | 15687V109 | 109,086.00 | $883,596.60 |
| 0.64% | Korn Ferry | 500643200 | 10,619.00 | $873,625.13 |
| 0.63% | Federated Hermes Inc | 314211103 | 14,369.00 | $861,565.24 |
| 0.63% | Middleby Corp/The | 596278101 | 6,501.00 | $868,403.58 |
| 0.62% | Cabot Corp | 127055101 | 9,743.00 | $857,578.86 |
| 0.62% | Pediatrix Medical Group Inc | 58502B106 | 32,306.00 | $856,432.06 |
| 0.62% | M/I Homes Inc | 55305B101 | 5,821.00 | $850,622.73 |
| 0.62% | Envista Holdings Corp | 29415F104 | 31,005.00 | $846,746.55 |
| 0.62% | Ziff Davis Inc | 48123V102 | 16,139.00 | $856,658.12 |
| 0.61% | PROG Holdings Inc | 74319R101 | 18,987.00 | $835,807.74 |
| 0.61% | ScanSource Inc | 806037107 | 14,815.00 | $838,825.30 |
| 0.60% | Alarm.com Holdings Inc | 011642105 | 15,061.00 | $824,589.75 |
| 0.60% | CVR Energy Inc | 12662P108 | 23,149.00 | $824,567.38 |
| 0.60% | Harmony Biosciences Holdings Inc | 413197104 | 23,576.00 | $830,818.24 |
| 0.60% | Dorian LPG Ltd | Y2106R110 | 17,364.00 | $823,400.88 |
| 0.59% | Gentex Corp | 371901109 | 34,637.00 | $809,120.32 |
| 0.59% | Option Care Health Inc | 68404L201 | 35,095.00 | $808,237.85 |
| 0.58% | Addus HomeCare Corp | 006739106 | 6,885.00 | $795,079.80 |
| 0.58% | Boise Cascade Co | 09739D100 | 10,510.00 | $802,753.80 |
| 0.58% | California Resources Corp | 13057Q305 | 15,115.00 | $795,351.30 |
| 0.58% | Kforce Inc | 493732101 | 14,000.00 | $794,780.00 |
| 0.58% | Qorvo Inc | 74736K101 | 8,794.00 | $796,472.58 |
| 0.58% | Talos Energy Inc | 87484T108 | 52,603.00 | $798,513.54 |
| 0.58% | Weatherford International PLC | G48833118 | 9,010.00 | $790,987.90 |
| 0.58% | Worthington Enterprises Inc | 981811102 | 14,097.00 | $792,392.37 |
| 0.57% | GigaCloud Technology Inc | G38644103 | 17,943.00 | $784,826.82 |
| 0.57% | Patterson-UTI Energy Inc | 703481101 | 74,688.00 | $782,730.24 |
| 0.57% | V2X Inc | 92242T101 | 8,689.00 | $784,095.36 |
| 0.57% | Yelp Inc | 985817105 | 29,544.00 | $780,847.92 |
| 0.56% | Collegium Pharmaceutical Inc | 19459J104 | 21,904.00 | $775,182.56 |
| 0.56% | ICF International Inc | 44925C103 | 9,498.00 | $768,578.16 |
| 0.56% | IDT Corp | 448947507 | 11,691.00 | $769,969.26 |
| 0.56% | Ironwood Pharmaceuticals Inc | 46333X108 | 182,340.00 | $771,298.20 |
| 0.56% | Prestige Consumer Healthcare Inc | 74112D101 | 15,316.00 | $769,169.52 |
| 0.55% | AdaptHealth Corp | 00653Q102 | 70,109.00 | $757,177.20 |
| 0.55% | Columbia Sportswear Co | 198516106 | 12,710.00 | $754,719.80 |
| 0.55% | DNOW Inc | 67011P100 | 53,094.00 | $749,687.28 |
| 0.55% | LCI Industries | 50189K103 | 7,381.00 | $755,519.16 |
| 0.55% | Maximus Inc | 577933104 | 12,485.00 | $752,221.25 |
| 0.55% | Interface Inc | 458665304 | 22,031.00 | $754,782.06 |
| 0.54% | Donnelley Financial Solutions Inc | 25787G100 | 15,801.00 | $747,387.30 |
| 0.53% | Tidewater Inc | 88642R109 | 9,780.00 | $734,086.80 |
| 0.52% | Alamo Group Inc | 011311107 | 4,490.00 | $714,269.20 |
| 0.52% | Carter's Inc | 146229109 | 18,618.00 | $718,096.26 |
| 0.52% | Pacira BioSciences Inc | 695127100 | 27,153.00 | $717,110.73 |
| 0.52% | ePlus Inc | 294268107 | 7,754.00 | $716,547.14 |
| 0.51% | Blue Bird Corp | 095306106 | 9,408.00 | $699,861.12 |
| 0.51% | Herbalife Ltd | G4412G101 | 56,093.00 | $696,675.06 |
| 0.51% | Boston Beer Co Inc/The | 100557107 | 3,849.00 | $705,136.80 |
| 0.50% | Adient PLC | G0084W101 | 32,774.00 | $689,564.96 |
| 0.50% | Amphastar Pharmaceuticals Inc | 03209R103 | 34,488.00 | $687,690.72 |
| 0.50% | Apogee Enterprises Inc | 037598109 | 17,420.00 | $689,832.00 |
| 0.50% | Peabody Energy Corp | 704551100 | 32,459.00 | $692,025.88 |
| 0.50% | Core Natural Resources Inc | 218937100 | 8,653.00 | $690,855.52 |
| 0.50% | Gulfport Energy Corp | 402635502 | 4,237.00 | $683,724.69 |
| 0.49% | Helix Energy Solutions Group Inc | 42330P107 | 71,058.00 | $675,761.58 |
| 0.49% | Innoviva Inc | 45781M101 | 31,862.00 | $668,146.14 |
| 0.49% | Stride Inc | 86333M108 | 8,310.00 | $667,209.90 |
| 0.49% | Sylvamo Corp | 871332102 | 17,985.00 | $672,818.85 |
| 0.49% | Winnebago Industries Inc | 974637100 | 22,181.00 | $671,640.68 |
| 0.48% | GoodRx Holdings Inc | 38246G108 | 216,162.00 | $663,617.34 |
| 0.48% | Marzetti Company/The | 513847103 | 6,144.00 | $656,609.28 |
| 0.48% | Perdoceo Education Corp | 71363P106 | 20,651.00 | $656,908.31 |
| 0.48% | Tactile Systems Technology Inc | 87357P100 | 23,575.00 | $664,107.75 |
| 0.48% | Teradata Corp | 88076W103 | 21,420.00 | $663,805.80 |
| 0.47% | Ardmore Shipping Corp | Y0207T100 | 36,881.00 | $641,360.59 |
| 0.47% | Upwork Inc | 91688F104 | 71,096.00 | $651,239.36 |
| 0.46% | Buckle Inc/The | 118440106 | 14,333.00 | $627,355.41 |
| 0.46% | Lindsay Corp | 535555106 | 5,729.00 | $634,887.78 |
| 0.46% | NerdWallet Inc | 64082B102 | 70,712.00 | $636,408.00 |
| 0.46% | Parsons Corp | 70202L102 | 14,292.00 | $631,849.32 |
| 0.46% | Root Inc/OH | 77664L207 | 11,724.00 | $634,854.60 |
| 0.45% | J & J Snack Foods Corp | 466032109 | 8,152.00 | $623,628.00 |
| 0.45% | Riley Exploration Permian Inc | 76665T102 | 18,056.00 | $618,779.12 |
| 0.45% | Scholastic Corp | 807066105 | 15,220.00 | $618,693.00 |
| 0.44% | Simply Good Foods Co/The | 82900L102 | 59,335.00 | $604,030.30 |
| 0.43% | National Beverage Corp | 635017106 | 18,755.00 | $593,408.20 |
| 0.43% | SunCoke Energy Inc | 86722A103 | 69,839.00 | $592,234.72 |
| 0.43% | Worthington Steel Inc | 982104101 | 16,335.00 | $588,223.35 |
| 0.39% | Alpha Metallurgical Resources Inc | 020764106 | 3,898.00 | $534,649.68 |
| 0.23% | Midera Food Processing Inc | 59739R104 | 6,501.00 | $311,722.95 |
| 0.00% | Cash & Other | Cash&Other | -4,733.99 | $-4,733.99 |
Holdings are subject to change at any time and should not be considered a recommendation to buy or sell any security.
LITERATURE
IMPORTANT INFORMATION
The Funds’ investment objectives, risks, charges, and expenses must be considered carefully before investing. The prospectus contains this and other important information about the investment company. Please read it carefully before investing. A hard copy of the prospectus can be requested by calling 1-800-617-0004.
Investing involves risk, including the possible loss of principal.
Shares of any ETF are bought and sold at market price (not NAV) and may trade at a discount or premium to NAV. Shares are not individually redeemed from the Fund. Brokerage commissions will reduce returns.The NAV of the Fund’s shares is calculated each day the national securities exchanges are open for trading as of the close of regular trading on the New York Stock Exchange (“NYSE”), normally 4:00 p.m. Eastern time (the “NAV Calculation Time”). Market price returns are based on either or both of the last trade of the day before the close of regular trading or the midpoint of the bid/ask spread at 4:00 pm Eastern Time (when NAV is normally determined).
To the extent the Fund invests more heavily in particular sectors of the economy, its performance will be especially sensitive to developments that significantly affect those sectors. Market Capitalization Risk. The securities of small- and mid-capitalization companies may be more vulnerable to adverse issuer, market, political, or economic developments than securities of large-capitalization companies. As an ETF, the fund may trade at a premium or discount to NAV. Shares of any ETF are bought and sold at market price (not NAV) and are not individually redeemed from the Fund.
Free Cash Flow (or Cash Flow): Refers to the cash generated by a business after accounting for capital investments required to maintain or grow the business.
Morningstar US Small Cap Index: Tracks the performance of common stock prices representative of small-cap and certain mid-cap U.S. securities. It is not possible to invest directly in an index.
The Distillate Capital ETFs are distributed by PINE Distributors LLC.