
Distillate Small/Mid
Cash Flow ETF | Ticker DSMC

Distillate Small/Mid Cash Flow ETF | DSMC Process
DSMC adheres to a systematic process, including only those stocks that meet the firm’s proprietary cash-flow-based valuation and quality criteria.
- DSMC begins with a starting universe of around 1,000 profitable small-and mid-cap U.S stock.
- Our security selection process eliminates those stocks with high debt levels.
- We then invest in the most attractively valued remaining 150 companies based on Distillate Capital’s normalized free cash flow methodology.
- The portfolio is weighted by free cash flow generation and is rebalanced quarterly.
As of 11/17/2025
| Ticker | DSMC |
| NAV | 33.42 |
| Market Price | 33.43 |
| Net Assets | $102,761,821 |
| Shares Outstanding | 3,075,000 |
| 30-day SEC Yield as of 10/31/2025 | 1.37% |
| Inception | 10/5/2022 |
| Primary Exchange | NYSE |
| CUSIP | 26922B667 |
| Expense Ratio | 0.55% |
| Premium/Discount % | 0.03 |
| Median 30-day Bid/Ask Spread | 0.11% |
The 30-day SEC yield represents the dividends and interest earned over the preceding 30-day period, annualized, and divided by the net asset value (NAV) per share at the end of the period.
Median 30-Day Spread is a calculation of Fund’s median bid-ask spread, expressed as a percentage rounded to the nearest hundredth, computed by: identifying the Fund’s national best bid and national best offer as of the end of each 10 second interval during each trading day of the last 30 calendar days; dividing the difference between each such bid and offer by the midpoint of the national best bid and national best offer; and identifying the median of those values.
GROWTH OF $10,000
SINCE INCEPTION
10/5/2022-9/30/2025
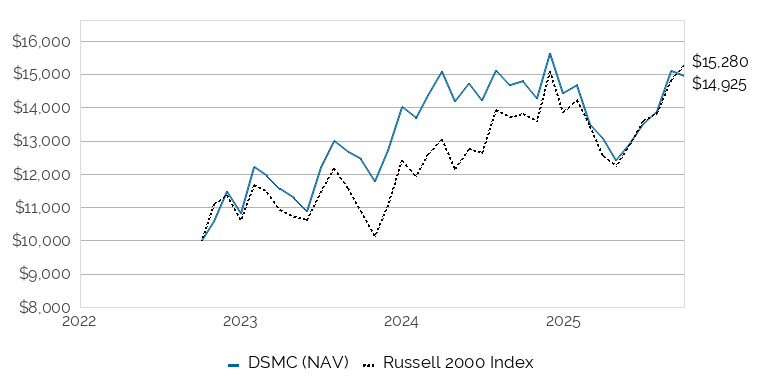
This chart illustrates the performance of a hypothetical $10,000 investment made on 10/5/2022, and is not intended to imply any future performance. The returns shown do not reflect the deduction of taxes that a shareholder would pay on fund distributions or the redemption of fund shares. The chart assumes reinvestment of capital gains and dividends.
PERFORMANCE
As of 10/31/2025
| YTD | 1 YR1 | 3 YR | SINCE INCEPTION2 | |
|---|---|---|---|---|
| 1DSMC NAV | -0.33% | 0.66% | 10.78% | 12.56% |
| 2DSMC MKT | -0.23% | 0.60% | 10.78% | 12.59% |
| 3Russell 2000 Index | 12.39% | 14.41% | 11.94% | 13.37% |
Fund expense ratio: 0.55%
1Performance greater than 1 year is annualized.
2Inception 10/5/22.
Performance data quoted represents past performance and does not guarantee future results. Investment returns and principal value will fluctuate, and when sold, may be worth more or less than their original cost. Performance current to the most recent month-end may be lower or higher than the performance quoted and can be obtained by calling 800.617.0004. Market price returns are based on price of the last reported trade on the fund’s primary exchange where the shares are listed. NAV return is the percentage change between the fund’s net asset value (the value of each share’s portion of the fund’s underlying assets and cash at the end of the trading day) at the beginning and end of a particular period.
As of 11/17/2025
| 2023 | 2024 | Q1 2025 | Q2 2025 | Q3 2025 | Q4 2025 | |
|---|---|---|---|---|---|---|
| Days at premium | 141 | 212 | 39 | 34 | 49 | 27 |
| Days at zero premium/discount | 20 | 8 | 2 | 5 | 2 | 1 |
| Days at discount | 86 | 32 | 20 | 23 | 13 | 6 |
DISTRIBUTIONS
| Ex-Date | Record Date | Payable Date | Amount | Type |
|---|---|---|---|---|
| 09/24/2025 | 09/24/2025 | 09/25/2025 | $0.08623 | Div Income |
| 06/25/2025 | 06/25/2025 | 06/26/2025 | $0.10760 | Div Income |
| 03/26/2025 | 03/26/2025 | 03/27/2025 | $0.07560 | Div Income |
| 12/27/2024 | 12/27/2024 | 12/30/2024 | $0.16000 | Div Income |
| 09/25/2024 | 09/25/2024 | 09/26/2024 | $0.09517 | Div Income |
| 06/26/2024 | 06/26/2024 | 06/27/2024 | $0.10473 | Div Income |
| 03/20/2024 | 03/21/2024 | 03/22/2024 | $0.09844 | Div Income |
| 12/27/2023 | 12/28/2023 | 12/29/2023 | $0.10725 | Div Income |
TOP 10 HOLDINGS
As of 11/18/2025
| Percent Net Assets | Name | Identifier | Shares Held | Market Value |
|---|---|---|---|---|
| 1.14% | APA Corp | 03743Q108 | 48,115.00 | $1,173,043.70 |
| 1.14% | HF Sinclair Corp | 403949100 | 21,388.00 | $1,175,912.24 |
| 1.14% | Skyworks Solutions Inc | 83088M102 | 18,684.00 | $1,166,815.80 |
| 1.11% | Antero Resources Corp | 03674X106 | 33,891.00 | $1,140,093.24 |
| 1.07% | DXC Technology Co | 23355L106 | 88,457.00 | $1,102,174.22 |
| 1.06% | Dillard's Inc | 254067101 | 1,829.00 | $1,089,462.14 |
| 1.01% | Range Resources Corp | 75281A109 | 27,337.00 | $1,042,906.55 |
| 0.99% | Mosaic Co/The | 61945C103 | 41,351.00 | $1,013,926.52 |
| 0.98% | Mueller Industries Inc | 624756102 | 9,644.00 | $1,010,787.64 |
| 0.98% | Ovintiv Inc | 69047Q102 | 26,364.00 | $1,007,104.80 |
| 0.96% | Atkore Inc | 047649108 | 15,273.00 | $987,399.45 |
| 0.92% | Gap Inc/The | 364760108 | 39,647.00 | $942,409.19 |
| 0.91% | BorgWarner Inc | 099724106 | 21,602.00 | $938,174.86 |
| 0.91% | Core Natural Resources Inc | 218937100 | 11,718.00 | $932,635.62 |
| 0.90% | Chord Energy Corp | 674215207 | 10,218.00 | $921,357.06 |
| 0.90% | Matson Inc | 57686G105 | 8,865.00 | $927,810.90 |
| 0.89% | Andersons Inc/The | 034164103 | 18,738.00 | $918,724.14 |
| 0.89% | Black Stone Minerals LP | 09225M101 | 67,240.00 | $913,119.20 |
| 0.89% | DNOW Inc | 67011P100 | 74,780.98 | $910,832.34 |
| 0.88% | TopBuild Corp | 89055F103 | 2,244.00 | $905,633.52 |
| 0.87% | CNX Resources Corp | 12653C108 | 24,728.00 | $893,175.36 |
| 0.87% | Signet Jewelers Ltd | G81276100 | 9,383.00 | $896,920.97 |
| 0.86% | Civitas Resources Inc | 17888H103 | 31,728.00 | $879,182.88 |
| 0.85% | EnerSys | 29275Y102 | 6,548.00 | $877,170.08 |
| 0.85% | Owens Corning | 690742101 | 8,846.00 | $876,903.98 |
| 0.85% | Weatherford International PLC | G48833118 | 12,335.00 | $875,414.95 |
| 0.84% | Interpublic Group of Cos Inc/The | 460690100 | 34,669.00 | $867,765.07 |
| 0.83% | Crocs Inc | 227046109 | 11,119.00 | $857,830.85 |
| 0.83% | Dropbox Inc | 26210C104 | 28,681.00 | $851,825.70 |
| 0.83% | Taylor Morrison Home Corp | 87724P106 | 14,827.00 | $857,000.60 |
| 0.82% | Teradata Corp | 88076W103 | 32,147.00 | $840,001.11 |
| 0.81% | Alliance Resource Partners LP | 01877R108 | 34,214.00 | $829,689.50 |
| 0.81% | International Seaways Inc | Y41053102 | 15,585.00 | $835,356.00 |
| 0.81% | Mattel Inc | 577081102 | 44,608.00 | $835,061.76 |
| 0.81% | Molina Healthcare Inc | 60855R100 | 6,069.00 | $830,178.51 |
| 0.80% | Etsy Inc | 29786A106 | 15,021.00 | $820,447.02 |
| 0.80% | H&R Block Inc | 093671105 | 18,796.00 | $822,888.88 |
| 0.79% | Allison Transmission Holdings Inc | 01973R101 | 10,297.00 | $816,243.19 |
| 0.78% | LCI Industries | 50189K103 | 7,647.00 | $802,093.83 |
| 0.78% | Pediatrix Medical Group Inc | 58502B106 | 35,024.00 | $806,252.48 |
| 0.77% | Pilgrim's Pride Corp | 72147K108 | 21,159.00 | $787,537.98 |
| 0.77% | Steven Madden Ltd | 556269108 | 21,406.00 | $791,593.88 |
| 0.76% | Amdocs Ltd | G02602103 | 10,346.00 | $776,467.30 |
| 0.75% | KB Home | 48666K109 | 13,177.00 | $771,513.35 |
| 0.75% | Lear Corp | 521865204 | 7,544.00 | $768,582.72 |
| 0.75% | ODP Corp/The | 88337F105 | 27,622.00 | $769,272.70 |
| 0.75% | ePlus Inc | 294268107 | 8,777.00 | $767,987.50 |
| 0.75% | Qorvo Inc | 74736K101 | 9,383.00 | $765,934.29 |
| 0.74% | Cal-Maine Foods Inc | 128030202 | 8,695.00 | $765,246.95 |
| 0.74% | Genpact Ltd | G3922B107 | 17,306.00 | $756,964.44 |
| 0.74% | Ingredion Inc | 457187102 | 7,115.00 | $761,305.00 |
| 0.74% | Smithfield Foods Inc | 832248207 | 35,759.00 | $757,375.62 |
| 0.73% | Reynolds Consumer Products Inc | 76171L106 | 31,132.00 | $754,172.70 |
| 0.72% | SEI Investments Co | 784117103 | 9,372.00 | $738,419.88 |
| 0.71% | AllianceBernstein Holding LP | 01881G106 | 18,765.00 | $730,333.80 |
| 0.71% | A O Smith Corp | 831865209 | 11,548.00 | $731,103.88 |
| 0.71% | California Resources Corp | 13057Q305 | 15,263.00 | $729,266.14 |
| 0.71% | Premier Inc | 74051N102 | 25,973.00 | $732,178.87 |
| 0.71% | Patterson-UTI Energy Inc | 703481101 | 126,414.00 | $731,937.06 |
| 0.71% | Talos Energy Inc | 87484T108 | 70,587.00 | $734,104.80 |
| 0.70% | Collegium Pharmaceutical Inc | 19459J104 | 15,874.00 | $719,727.16 |
| 0.70% | Cirrus Logic Inc | 172755100 | 6,217.00 | $717,690.48 |
| 0.69% | Arrow Electronics Inc | 042735100 | 6,795.00 | $712,523.70 |
| 0.69% | Carter's Inc | 146229109 | 23,159.00 | $707,275.86 |
| 0.69% | Kennametal Inc | 489170100 | 27,545.00 | $713,966.40 |
| 0.68% | Euronet Worldwide Inc | 298736109 | 9,886.00 | $699,137.92 |
| 0.67% | Artisan Partners Asset Management Inc | 04316A108 | 16,713.00 | $687,071.43 |
| 0.67% | Bath & Body Works Inc | 070830104 | 31,973.00 | $685,820.85 |
| 0.67% | Middleby Corp/The | 596278101 | 5,977.00 | $683,649.26 |
| 0.67% | Sylvamo Corp | 871332102 | 15,100.00 | $689,466.00 |
| 0.67% | Thermon Group Holdings Inc | 88362T103 | 20,593.00 | $693,572.24 |
| 0.65% | GigaCloud Technology Inc | G38644103 | 22,391.00 | $669,490.90 |
| 0.65% | Option Care Health Inc | 68404L201 | 23,615.00 | $663,817.65 |
| 0.65% | Tutor Perini Corp | 901109108 | 11,440.00 | $672,214.40 |
| 0.65% | TRI POINTE GROUP INC | 87265H109 | 21,816.00 | $669,314.88 |
| 0.64% | Mohawk Industries Inc | 608190104 | 6,367.00 | $662,040.66 |
| 0.64% | WEX Inc | 96208T104 | 4,845.00 | $660,858.00 |
| 0.63% | Federated Hermes Inc | 314211103 | 13,398.00 | $642,568.08 |
| 0.63% | G-III Apparel Group Ltd | 36237H101 | 23,831.00 | $648,441.51 |
| 0.63% | Lantheus Holdings Inc | 516544103 | 12,354.00 | $648,585.00 |
| 0.62% | Academy Sports & Outdoors Inc | 00402L107 | 14,841.00 | $640,537.56 |
| 0.62% | Columbia Sportswear Co | 198516106 | 12,423.00 | $639,163.35 |
| 0.62% | Heidrick & Struggles International Inc | 422819102 | 10,901.00 | $639,343.65 |
| 0.61% | Hub Group Inc | 443320106 | 17,559.00 | $626,856.30 |
| 0.61% | Teleflex Inc | 879369106 | 6,034.00 | $626,691.24 |
| 0.61% | Victory Capital Holdings Inc | 92645B103 | 10,168.00 | $628,179.04 |
| 0.60% | Buckle Inc/The | 118440106 | 11,056.00 | $612,612.96 |
| 0.59% | Axcelis Technologies Inc | 054540208 | 7,546.00 | $607,679.38 |
| 0.59% | Dole PLC | G27907107 | 42,851.00 | $601,628.04 |
| 0.59% | Kimbell Royalty Partners LP | 49435R102 | 46,122.00 | $606,965.52 |
| 0.59% | NetScout Systems Inc | 64115T104 | 22,636.00 | $604,833.92 |
| 0.59% | YETI Holdings Inc | 98585X104 | 16,919.00 | $608,576.43 |
| 0.58% | eXp World Holdings Inc | 30212W100 | 57,214.00 | $600,174.86 |
| 0.58% | Scholastic Corp | 807066105 | 21,278.00 | $594,932.88 |
| 0.57% | Envista Holdings Corp | 29415F104 | 30,497.00 | $582,797.67 |
| 0.57% | Prestige Consumer Healthcare Inc | 74112D101 | 9,938.00 | $586,143.24 |
| 0.57% | Robert Half Inc | 770323103 | 22,214.00 | $580,896.10 |
| 0.56% | Omnicell Inc | 68213N109 | 16,868.00 | $576,716.92 |
| 0.56% | Supernus Pharmaceuticals Inc | 868459108 | 12,836.00 | $578,775.24 |
| 0.56% | V2X Inc | 92242T101 | 10,869.00 | $579,969.84 |
| 0.56% | Worthington Enterprises Inc | 981811102 | 11,001.00 | $579,312.66 |
| 0.55% | ASGN Inc | 00191U102 | 13,567.00 | $563,708.85 |
| 0.55% | Enphase Energy Inc | 29355A107 | 20,511.00 | $564,667.83 |
| 0.55% | Genco Shipping & Trading Ltd | Y2685T131 | 32,303.00 | $568,209.77 |
| 0.55% | Harmony Biosciences Holdings Inc | 413197104 | 16,490.00 | $560,495.10 |
| 0.55% | Korn Ferry | 500643200 | 8,947.00 | $568,581.85 |
| 0.55% | Photronics Inc | 719405102 | 27,235.00 | $564,853.90 |
| 0.55% | ScanSource Inc | 806037107 | 14,586.00 | $565,790.94 |
| 0.55% | TriNet Group Inc | 896288107 | 10,246.00 | $561,275.88 |
| 0.54% | Gentex Corp | 371901109 | 24,735.00 | $553,569.30 |
| 0.54% | Phinia Inc | 71880K101 | 10,605.00 | $556,550.40 |
| 0.53% | CTS Corp | 126501105 | 13,360.00 | $548,294.40 |
| 0.53% | Dorian LPG Ltd | Y2106R110 | 21,565.00 | $549,260.55 |
| 0.53% | Boston Beer Co Inc/The | 100557107 | 2,798.00 | $542,560.18 |
| 0.52% | Monarch Casino & Resort Inc | 609027107 | 5,606.00 | $529,710.94 |
| 0.52% | Insight Enterprises Inc | 45765U103 | 6,018.00 | $533,134.62 |
| 0.52% | Perdoceo Education Corp | 71363P106 | 17,869.00 | $538,392.97 |
| 0.52% | Steelcase Inc | 858155203 | 34,585.00 | $536,413.35 |
| 0.51% | PC Connection Inc | 69318J100 | 9,169.00 | $519,148.78 |
| 0.50% | Adient PLC | G0084W101 | 26,773.00 | $510,025.65 |
| 0.50% | Abercrombie & Fitch Co | 002896207 | 7,334.00 | $510,299.72 |
| 0.50% | ArcBest Corp | 03937C105 | 8,233.00 | $514,809.49 |
| 0.50% | EVERTEC Inc | 30040P103 | 18,195.00 | $515,100.45 |
| 0.50% | Kforce Inc | 493732101 | 17,372.00 | $511,605.40 |
| 0.50% | Masterbrand Inc | 57638P104 | 52,683.00 | $517,347.06 |
| 0.50% | Virtus Investment Partners Inc | 92828Q109 | 3,292.00 | $511,675.56 |
| 0.50% | John Wiley & Sons Inc | 968223206 | 15,000.00 | $512,700.00 |
| 0.49% | Adeia Inc | 00676P107 | 40,501.00 | $502,617.41 |
| 0.49% | Cars.com Inc | 14575E105 | 44,471.00 | $498,964.62 |
| 0.49% | Ziff Davis Inc | 48123V102 | 16,876.00 | $503,073.56 |
| 0.48% | Amphastar Pharmaceuticals Inc | 03209R103 | 19,011.00 | $494,666.22 |
| 0.48% | HNI Corp | 404251100 | 12,953.00 | $495,711.31 |
| 0.48% | Pacira BioSciences Inc | 695127100 | 20,718.00 | $494,745.84 |
| 0.48% | SunCoke Energy Inc | 86722A103 | 77,529.00 | $496,960.89 |
| 0.46% | ManpowerGroup Inc | 56418H100 | 16,878.00 | $472,752.78 |
| 0.46% | Gibraltar Industries Inc | 374689107 | 9,979.00 | $470,410.06 |
| 0.45% | ICF International Inc | 44925C103 | 6,031.00 | $462,276.15 |
| 0.45% | PROG Holdings Inc | 74319R101 | 17,426.00 | $459,872.14 |
| 0.45% | Sturm Ruger & Co Inc | 864159108 | 15,232.00 | $461,072.64 |
| 0.44% | American Woodmark Corp | 030506109 | 9,110.00 | $449,396.30 |
| 0.43% | Apogee Enterprises Inc | 037598109 | 13,306.00 | $445,751.00 |
| 0.43% | Liquidity Services Inc | 53635B107 | 20,049.00 | $446,290.74 |
| 0.43% | Oxford Industries Inc | 691497309 | 13,162.00 | $445,007.22 |
| 0.41% | Simply Good Foods Co/The | 82900L102 | 20,940.00 | $422,778.60 |
| 0.40% | Ethan Allen Interiors Inc | 297602104 | 18,885.00 | $413,203.80 |
| 0.40% | Upbound Group Inc | 76009N100 | 24,864.00 | $409,261.44 |
| 0.36% | CALERES INC COM | 129500104 | 37,393.00 | $371,312.49 |
| 0.34% | Janus International Group Inc | 47103N106 | 58,376.00 | $347,920.96 |
| 0.25% | Thryv Holdings Inc | 886029206 | 44,826.00 | $260,439.06 |
| 0.13% | Cash & Other | Cash&Other | 134,272.54 | $134,272.54 |
| 0.11% | First American Government Obligations Fund 12/01/2031 | 31846V336 | 110,366.28 | $110,366.28 |
Holdings are subject to change at any time and should not be considered a recommendation to buy or sell any security.
LITERATURE
IMPORTANT INFORMATION
The Funds’ investment objectives, risks, charges, and expenses must be considered carefully before investing. The prospectus contains this and other important information about the investment company. Please read it carefully before investing. A hard copy of the prospectus can be requested by calling 1-800-617-0004.
Investing involves risk, including the possible loss of principal.
Shares of any ETF are bought and sold at market price (not NAV) and may trade at a discount or premium to NAV. Shares are not individually redeemed from the Fund. Brokerage commissions will reduce returns.The NAV of the Fund’s shares is calculated each day the national securities exchanges are open for trading as of the close of regular trading on the New York Stock Exchange (“NYSE”), normally 4:00 p.m. Eastern time (the “NAV Calculation Time”). Market price returns are based on either or both of the last trade of the day before the close of regular trading or the midpoint of the bid/ask spread at 4:00 pm Eastern Time (when NAV is normally determined).
To the extent the Fund invests more heavily in particular sectors of the economy, its performance will be especially sensitive to developments that significantly affect those sectors. Market Capitalization Risk. The securities of small- and mid-capitalization companies may be more vulnerable to adverse issuer, market, political, or economic developments than securities of large-capitalization companies. As an ETF, the fund may trade at a premium or discount to NAV. Shares of any ETF are bought and sold at market price (not NAV) and are not individually redeemed from the Fund.
Free Cash Flow (or Cash Flow): Refers to the cash generated by a business after accounting for capital investments required to maintain or grow the business.
Morningstar US Small Cap Index: Tracks the performance of common stock prices representative of small-cap and certain mid-cap U.S. securities. It is not possible to invest directly in an index.
The Distillate Capital ETFs are distributed by Quasar Distributors, LLC.