
Distillate International Fundamental
Stability & Value ETF | Ticker DSTX

Distillate International Fundamental Stability & Value ETF | DSTX Process
DSTX adheres to a systematic process, including only those stocks that meet the firm’s proprietary cash-flow-based valuation and quality criteria.
- DSTX begins with a starting universe of around 500 profitable large-cap U.S. stocks.
- Our security selection focuses on U.S. stocks with low debt levels and stable cash flows.
- We then invest in the most attractively valued remaining 100 companies based on Distillate Capital’s normalized free cash flow methodology.
- The portfolio is weighted by free cash flow generation and is rebalanced quarterly.
As of 01/30/2026
| Ticker | DSTX |
| NAV | 33.12 |
| Market Price | 32.96 |
| Net Assets | $43,055,221 |
| Shares Outstanding | 1,300,000 |
| 30-day SEC Yield as of 12/31/2025 | 2.07% |
| Inception | 12/14/2020 |
| Primary Exchange | NYSE |
| CUSIP | 26922B501 |
| Expense Ratio | 0.55% |
| Premium/Discount % | -0.48 |
| Median 30-day Bid/Ask Spread | 0.18% |
The 30-day SEC yield represents the dividends and interest earned over the preceding 30-day period, annualized, and divided by the net asset value (NAV) per share at the end of the period.
Median 30-Day Spread is a calculation of Fund’s median bid-ask spread, expressed as a percentage rounded to the nearest hundredth, computed by: identifying the Fund’s national best bid and national best offer as of the end of each 10 second interval during each trading day of the last 30 calendar days; dividing the difference between each such bid and offer by the midpoint of the national best bid and national best offer; and identifying the median of those values.
GROWTH OF $10,000
SINCE INCEPTION
12/14/2020-12/31/2025
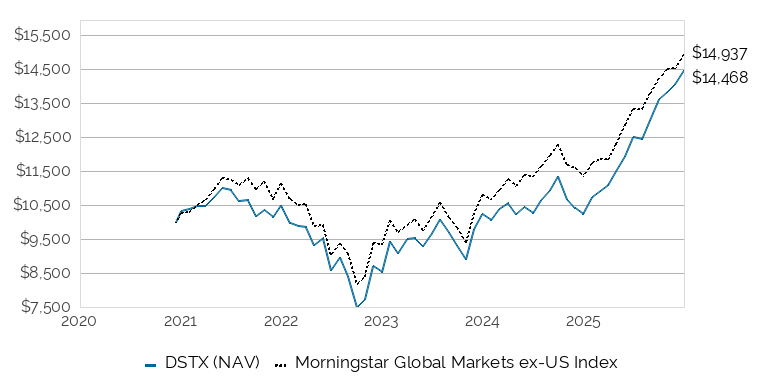
This chart illustrates the performance of a hypothetical $10,000 investment made on 12/14/2020, and is not intended to imply any future performance. The returns shown do not reflect the deduction of taxes that a shareholder would pay on fund distributions or the redemption of fund shares. The chart assumes reinvestment of capital gains and dividends.
PERFORMANCE
As of 12/31/2025
| YTD | 1 YR1 | 3 YR | SINCE INCEPTION2 | |
|---|---|---|---|---|
| 1DSTX NAV | 41.53% | 41.53% | 19.24% | 7.59% |
| 2DSTX MKT | 41.71% | 41.71% | 19.21% | 7.56% |
| 3Morningstar Global Markets ex-US NR USD | 31.60% | 31.60% | 16.95% | 8.28% |
Fund expense ratio: 0.55%
1Performance greater than 1 year is annualized.
2Inception 12/14/20.
Performance data quoted represents past performance and does not guarantee future results. Investment returns and principal value will fluctuate, and when sold, may be worth more or less than their original cost. Performance current to the most recent month-end may be lower or higher than the performance quoted and can be obtained by calling 800.617.0004. Market price returns are based on price of the last reported trade on the fund’s primary exchange where the shares are listed. NAV return is the percentage change between the fund’s net asset value (the value of each share’s portion of the fund’s underlying assets and cash at the end of the trading day) at the beginning and end of a particular period.
As of 01/30/2026
| 2023 | 2024 | 2025 | Q1 2026 | Q2 2026 | Q3 2026 | Q4 2026 | |
|---|---|---|---|---|---|---|---|
| Days at premium | 167 | 133 | 130 | 13 | - | - | - |
| Days at zero premium/discount | 4 | 3 | 3 | 0 | - | - | - |
| Days at discount | 76 | 116 | 118 | 7 | - | - | - |
DISTRIBUTIONS
| Ex-Date | Record Date | Payable Date | Amount | Type |
|---|---|---|---|---|
| 12/29/2025 | 12/29/2025 | 12/30/2025 | $0.47145 | Div Income |
| 09/24/2025 | 09/24/2025 | 09/25/2025 | $0.08061 | Div Income |
| 06/25/2025 | 06/25/2025 | 06/26/2025 | $0.29875 | Div Income |
| 03/26/2025 | 03/26/2025 | 03/27/2025 | $0.07757 | Div Income |
| 12/27/2024 | 12/27/2024 | 12/30/2024 | $0.16308 | Div Income |
| 09/25/2024 | 09/25/2024 | 09/26/2024 | $0.05917 | Div Income |
| 06/26/2024 | 06/26/2024 | 06/27/2024 | $0.29785 | Div Income |
| 03/20/2024 | 03/21/2024 | 03/22/2024 | $0.03507 | Div Income |
TOP 10 HOLDINGS
As of 02/02/2026
| Percent Net Assets | Name | Identifier | Shares Held | Market Value |
|---|---|---|---|---|
| 2.57% | Samsung Electronics Co Ltd | 4942818 | 402.00 | $1,107,108.00 |
| 2.03% | British American Tobacco PLC | 110448107 | 14,436.00 | $875,976.48 |
| 1.82% | Kia Corp | 6490928 | 7,407.00 | $785,263.44 |
| 1.70% | Vinci SA | B1XH026 | 5,073.00 | $731,154.62 |
| 1.64% | America Movil SAB de CV | BMVRB77 | 678,630.00 | $706,914.40 |
| 1.57% | Roche Holding AG | 771195104 | 11,918.00 | $676,346.50 |
| 1.53% | CANADIAN NAT RES LTD | 2171573 | 17,658.00 | $660,210.86 |
| 1.50% | Novartis AG | 7103065 | 4,346.00 | $646,891.14 |
| 1.49% | Kuaishou Technology | BLC90T0 | 62,600.00 | $642,456.18 |
| 1.47% | Grupo Mexico SAB de CV | 2643674 | 57,056.00 | $634,236.96 |
| 1.46% | JD.com Inc | BKPQZT6 | 43,700.00 | $628,946.05 |
| 1.42% | Agnico Eagle Mines Ltd | 2009823 | 3,207.00 | $613,004.38 |
| 1.39% | Volvo AB | B1QH830 | 16,329.00 | $597,655.51 |
| 1.36% | HD Hyundai Co Ltd | BD4HFT1 | 3,594.00 | $584,268.45 |
| 1.27% | Gold Fields Ltd | 6280215 | 10,296.00 | $545,509.85 |
| 1.27% | Sandvik AB | B1VQ252 | 13,753.00 | $546,406.86 |
| 1.26% | Telefonica Brasil SA | B6XFBX3 | 76,386.00 | $544,493.99 |
| 1.25% | Cie de Saint-Gobain SA | 7380482 | 5,422.00 | $536,794.64 |
| 1.22% | Denso Corp | 6640381 | 37,800.00 | $525,122.52 |
| 1.20% | London Stock Exchange Group PLC | B0SWJX3 | 4,626.00 | $515,587.01 |
| 1.19% | Evolution Mining Ltd | B3X0F91 | 49,660.00 | $511,750.74 |
| 1.17% | United Microelectronics Corp | 6916628 | 255,000.00 | $505,624.40 |
| 1.15% | Merck KGaA | 4741844 | 3,310.00 | $494,385.42 |
| 1.13% | IMPERIAL BRANDS PLC | 0454492 | 11,568.00 | $486,702.73 |
| 1.12% | Geely Automobile Holdings Ltd | 6531827 | 234,000.00 | $482,100.46 |
| 1.11% | Heidelberg Materials AG | 5120679 | 1,735.00 | $477,415.00 |
| 1.09% | Komatsu Ltd | 6496584 | 12,200.00 | $468,908.34 |
| 1.08% | Japan Tobacco Inc | 6474535 | 12,900.00 | $466,711.40 |
| 1.07% | Rio Tinto Ltd | 6220103 | 4,348.00 | $461,619.95 |
| 1.04% | INFOSYS LTD | 456788108 | 25,456.00 | $447,516.48 |
| 1.01% | Daikin Industries Ltd | 6250724 | 3,600.00 | $433,722.29 |
| 1.01% | SCREEN Holdings Co Ltd | 6251028 | 3,400.00 | $433,320.37 |
| 1.01% | Sonic Healthcare Ltd | 6821120 | 27,158.00 | $436,636.03 |
| 1.00% | JD Logistics Inc | BNMBPD9 | 301,900.00 | $432,572.44 |
| 0.99% | Beiersdorf AG | 5107401 | 3,566.00 | $426,139.93 |
| 0.98% | Genmab A/S | 4595739 | 1,306.00 | $420,686.29 |
| 0.97% | Ashtead Group PLC | 0053673 | 6,514.00 | $418,963.37 |
| 0.97% | Telkom Indonesia Persero Tbk PT | BD4T6W7 | 1,937,900.00 | $415,635.39 |
| 0.97% | Vibra Energia SA | BPBLV81 | 76,648.00 | $419,579.93 |
| 0.96% | Astellas Pharma Inc | 6985383 | 29,700.00 | $412,788.80 |
| 0.96% | Haidilao International Holding Ltd | BGN9715 | 203,000.00 | $415,373.19 |
| 0.96% | Yangzijiang Shipbuilding Holdings Ltd | B1VT035 | 156,900.00 | $412,959.81 |
| 0.95% | Shin-Etsu Chemical Co Ltd | 6804585 | 12,300.00 | $408,963.44 |
| 0.94% | Shionogi & Co Ltd | 6804682 | 19,600.00 | $403,282.77 |
| 0.94% | Essity AB | BF1K7P7 | 13,613.00 | $404,749.26 |
| 0.92% | Hyundai Glovis Co Ltd | B0V3XR5 | 2,365.00 | $397,617.06 |
| 0.92% | Brambles Ltd | B1FJ0C0 | 25,134.00 | $394,410.73 |
| 0.91% | NIDEC CORP | 6640682 | 27,400.00 | $391,834.57 |
| 0.91% | Suzuki Motor Corp | 6865504 | 28,600.00 | $390,547.78 |
| 0.91% | Publicis Groupe SA | 4380429 | 3,916.00 | $392,261.53 |
| 0.91% | TFI INTERNATIONAL INC | BDRXBF4 | 3,622.00 | $391,394.79 |
| 0.90% | Nexon Co Ltd | B63QM77 | 16,200.00 | $386,779.46 |
| 0.89% | Yokogawa Electric Corp | 6986427 | 11,500.00 | $382,289.64 |
| 0.89% | Capgemini SE | 4163437 | 2,453.00 | $382,870.87 |
| 0.89% | Fomento Economico Mexicano SAB de CV | 2242059 | 36,533.00 | $384,073.51 |
| 0.89% | TIM SA/Brazil | BN71RB6 | 82,127.00 | $383,532.80 |
| 0.88% | Mowi ASA | B02L486 | 16,338.00 | $376,832.42 |
| 0.87% | Norsk Hydro ASA | B11HK39 | 41,707.00 | $375,052.56 |
| 0.86% | China Nonferrous Mining Corp Ltd | B890GY2 | 185,000.00 | $371,909.29 |
| 0.86% | Otsuka Holdings Co Ltd | B5LTM93 | 6,200.00 | $371,413.20 |
| 0.86% | Danone SA | B1Y9TB3 | 4,738.00 | $371,112.71 |
| 0.86% | GEA Group AG | 4557104 | 5,147.00 | $369,838.44 |
| 0.86% | CGI Inc | BJ2L575 | 4,289.00 | $369,623.97 |
| 0.86% | Harmony Gold Mining Co Ltd | 6410562 | 16,398.00 | $371,895.90 |
| 0.85% | Kingsoft Corp Ltd | B27WRM3 | 95,000.00 | $366,390.51 |
| 0.85% | Wolters Kluwer NV | 5671519 | 3,893.00 | $365,318.99 |
| 0.84% | China Mengniu Dairy Co Ltd | B01B1L9 | 173,000.00 | $361,076.61 |
| 0.83% | Suntory Beverage & Food Ltd | BBD7Q84 | 11,300.00 | $356,961.62 |
| 0.83% | Cemex SAB de CV | 2406457 | 284,569.00 | $356,305.91 |
| 0.83% | Teleperformance SE | 5999330 | 5,488.00 | $356,473.86 |
| 0.82% | Wipro Ltd | 97651M109 | 140,050.00 | $352,926.00 |
| 0.80% | Bandai Namco Holdings Inc | B0JDQD4 | 13,200.00 | $343,134.97 |
| 0.80% | Whitecap Resources Inc | B418WK4 | 37,701.00 | $345,786.23 |
| 0.79% | Realtek Semiconductor Corp | 6051422 | 22,000.00 | $338,004.45 |
| 0.78% | Computershare Ltd | 6180412 | 14,746.00 | $337,904.42 |
| 0.78% | Constellation Software Inc/Canada | B15C4L6 | 180.00 | $334,034.49 |
| 0.78% | Magna International Inc | 559222401 | 6,583.00 | $336,654.62 |
| 0.77% | Niterra Co Ltd | 6619604 | 7,600.00 | $332,604.69 |
| 0.77% | Secom Co Ltd | 6791591 | 9,000.00 | $330,163.36 |
| 0.77% | DCC PLC | 0242493 | 5,198.00 | $330,683.90 |
| 0.77% | Intertek Group PLC | 3163836 | 5,431.00 | $332,688.16 |
| 0.75% | Ono Pharmaceutical Co Ltd | 6660107 | 21,600.00 | $322,403.73 |
| 0.75% | Unicharm Corp | 6911485 | 53,000.00 | $322,755.09 |
| 0.75% | NetEase Cloud Music Inc | BP2TRS6 | 14,000.00 | $323,571.97 |
| 0.75% | Buzzi SpA | 5782206 | 5,663.00 | $322,837.75 |
| 0.74% | International Games System Co Ltd | 6744807 | 14,000.00 | $318,525.58 |
| 0.74% | Otsuka Corp | 6267058 | 16,000.00 | $317,593.67 |
| 0.73% | Autotrader Group PLC | BVYVFW2 | 42,721.00 | $315,396.62 |
| 0.70% | Trend Micro Inc/Japan | 6125286 | 7,700.00 | $301,990.15 |
| 0.70% | Euronext NV | BNBNSG0 | 2,141.00 | $300,297.29 |
| 0.70% | Nexi SpA | BJ1F880 | 70,087.00 | $300,582.50 |
| 0.69% | IMCD NV | BNCBD46 | 3,174.00 | $297,470.46 |
| 0.65% | Bunzl PLC | B0744B3 | 10,000.00 | $281,036.87 |
| 0.64% | Samsung SDS Co Ltd | BRS2KY0 | 2,308.00 | $277,556.48 |
| 0.63% | Open Text Corp | 2260824 | 10,522.00 | $270,247.14 |
| 0.61% | Bureau Veritas SA | B28DTJ6 | 8,116.00 | $261,656.95 |
| 0.59% | Zalando SE | BQV0SV7 | 8,758.00 | $253,598.37 |
| 0.55% | Zhejiang Leapmotor Technology Co Ltd | BJLVDM7 | 43,900.00 | $238,451.93 |
| 0.53% | MatsukiyoCocokara & Co | B249GC0 | 14,200.00 | $228,105.80 |
| 0.50% | Pandora A/S | B44XTX8 | 2,673.00 | $216,745.84 |
| 0.37% | First American Government Obligations Fund 12/01/2031 | 31846V336 | 160,272.64 | $160,272.64 |
| 0.20% | Cash & Other | Cash&Other | 87,985.05 | $87,985.05 |
| 0.00% | Constellation Software Inc/Canada | BR52TP7 | 138.00 | $0.00 |
| 0.00% | BRAZILIAN REAL | CASHBRL | 20.09 | $3.84 |
| 0.00% | BRITISH POUNDS | CASHGBP | 5.98 | $8.21 |
Holdings are subject to change at any time and should not be considered a recommendation to buy or sell any security.
LITERATURE
IMPORTANT INFORMATION
The Funds’ investment objectives, risks, charges, and expenses must be considered carefully before investing. The prospectus contains this and other important information about the investment company. Please read it carefully before investing. A hard copy of the prospectus can be requested by calling 1-800-617-0004.
Investing involves risk, including the possible loss of principal.
Shares of any ETF are bought and sold at market price (not NAV) and may trade at a discount or premium to NAV. Shares are not individually redeemed from the Fund. Brokerage commissions will reduce returns.The NAV of the Fund’s shares is calculated each day the national securities exchanges are open for trading as of the close of regular trading on the New York Stock Exchange (“NYSE”), normally 4:00 p.m. Eastern time (the “NAV Calculation Time”). Market price returns are based on either or both of the last trade of the day before the close of regular trading or the midpoint of the bid/ask spread at 4:00 pm Eastern Time (when NAV is normally determined).
To the extent the Fund invests more heavily in particular sectors of the economy, its performance will be especially sensitive to developments that significantly affect those sectors. Market Capitalization Risk. The securities of small- and mid-capitalization companies may be more vulnerable to adverse issuer, market, political, or economic developments than securities of large-capitalization companies. Foreign Securities Risk: The Fund invests in foreign securities which involve political, economic and currency risks, greater volatility and differences in accounting methods. These risks are greater in emerging markets.
Free Cash Flow (or Cash Flow): Refers to the cash generated by a business after accounting for capital investments required to maintain or grow the business.
Morningstar Global Markets Ex-U.S. Index: An unmanaged index of common stock prices, weighted by market value. Its performance is thought to be representative of the non-U.S. stock market as a whole. It is not possible to invest directly in an index.
The Distillate Capital ETFs are distributed by Quasar Distributors, LLC.